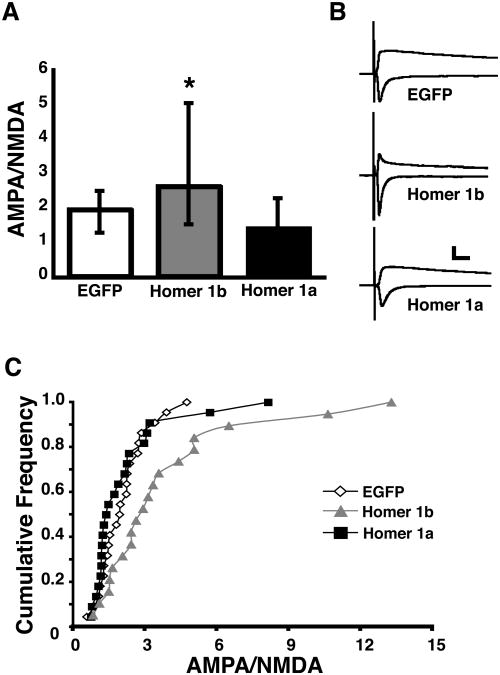
Figure 7.
Homer1b expression increases AMPA to NMDA ratios. (A) Medians and IQR of AMPA to NMDA ratio for cells expressing EGFP, Homer 1a, or Homer 1b. (B) Representative AMPA and NMDA traces for each condition. AMPA currents were recorded at −60mV;AMPA and NMDA currents were recorded at +55mV. Scale bar = 50 pA and 20 msec. (C) Cumulative frequency plot of all of the data points for each condition. (n =19-22 cells in each condition).

