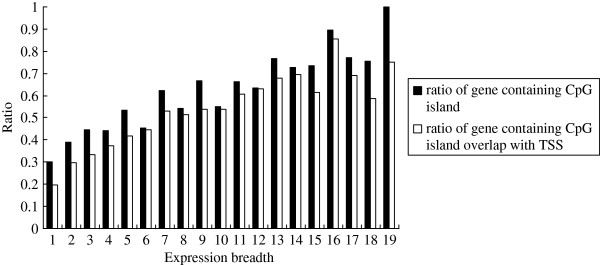
Figure 1.

Ratio of genes containing CpG islands according to different values of expression breadth. CpG islands were identified using hgTables of the UCSC Genome Browser (http://genome.ucsc.edu/); the following search criteria were used: GC content ≥ 55%, ObsCpG/ExpCpG ≥ 0.65, and length ≥ 500 bp; the ratio of genes containing CpG islands is significantly and positively correlated with expression breadth at a very high coefficient (r = 0.9342, P < 0.0001); the ratio of genes containing CpG islands overlapping with TSS is also highly correlated with expression breadth (r = 0.9114, P < 0.0001).
