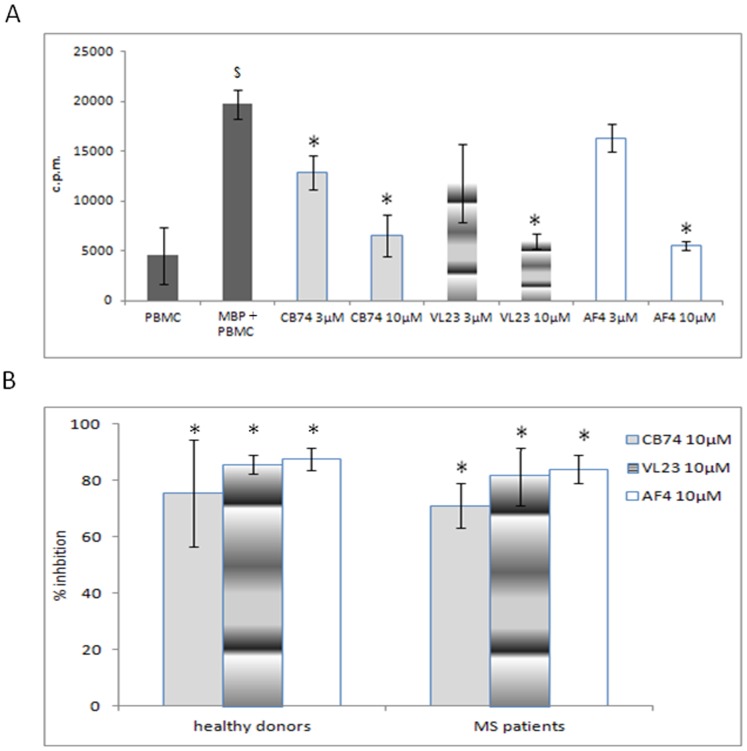
Figure 1. 1,8-naphthyridine, pyridine and quinoline derivatives inhibit proliferation of MBP-activated PBMC.
MBP activated PBMC of MS patients (2×10⁵ cells per well) were treated with the compounds at the indicated concentrations, in triplicate, for 6 days. Proliferation was measured after 1 h of 3H-thymidine incorporation (1 µCi). The counts per minutes (c.p.m.) ± the standard deviation of the triplicates of a representative experiment out of five are shown (A). The activation following MBP stimulation was evaluated with respect to MBP untreated cells, (PBMC in the figure) ($p<0,01). The statistical significance for each compound used at the concentrations of 3 and 10 µM, was calculated with respect to the MBP-activated cells (*p<0,05, MBP+PBMC in the figure). The histogram B represents the percent of inhibition of cell proliferation calculated with respect to drug untreated and MBP activated cells isolated from MS patients and healthy donors as indicated in the figure (*p<0,01). The percent of inhibition reported is the mean of five independent experiments and the bars represents the standard deviations.

