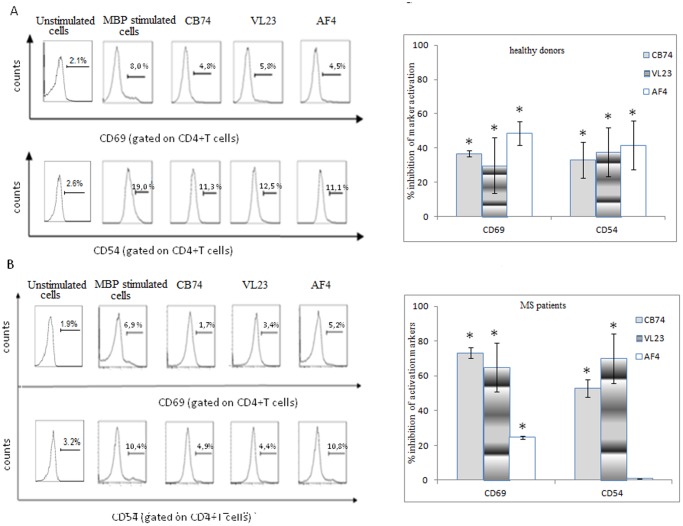
Figure 4. 1,8-naphthyridine, pyridine and quinoline derivatives inhibit T cell activation markers, CD69 and CD54 adhesion molecule.
MBP activated PBMC were treated with the drugs at the concentration of 10 µM and cultured for 6 days. After the incubation, cells were collected and stained with the antibodies indicated in the figure. Cells were analyzed by flow cytometry gating on the lymphocyte region of CD4+T cells. In the flow cytometric profile, representative of at least four independent experiments, cells expressing CD69 and CD54 in control PBMCs (Fig. 4A) and patient derived PBMCs (Fig. 4B), are showed along with the percent of expression of these markers. The control is represented by MBP activated cells. A further control, un-stimulated cells is also showed in the figure (A, B). The statistical analysis was performed on four independent experiments and the mean percent of marker inhibition ± the standard deviation of these experiments is reported on the right panels (*p<0,05 calculated with respect to MBP activated cells).

