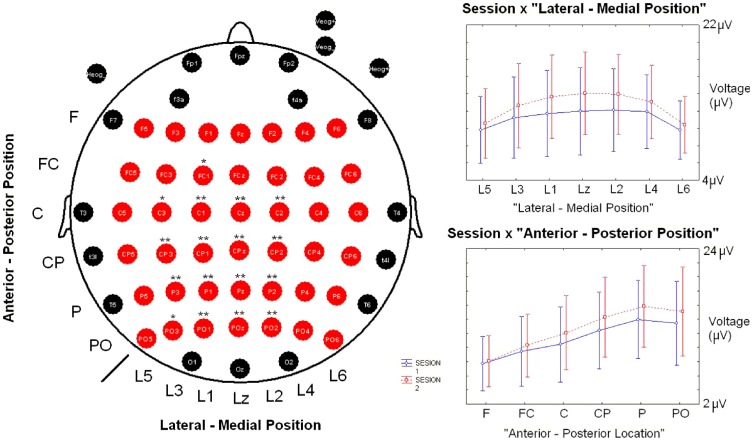
Figure 1. Electrode array and statistically significant interactions in the ANOVA of the amplitude.
On the left side, fifty-eight of the 64 EEG electrodes used are depicted. The red electrodes were used to analyze the amplitude differences between sessions. Statistical results for the ANOVA (after Bonferroni correction) in the comparison of amplitudes between sessions are coded as * p<0.05 and ** p<0.001. On the right side, graphics for interactions that were statistically significant in the ANOVA are displayed. Abbreviations: F (frontal), FC (Frontocentral), C (Central), CP (Centroparietal), P (Parietal), PO (Parietooccipital). L (line), z (zero or midline).

