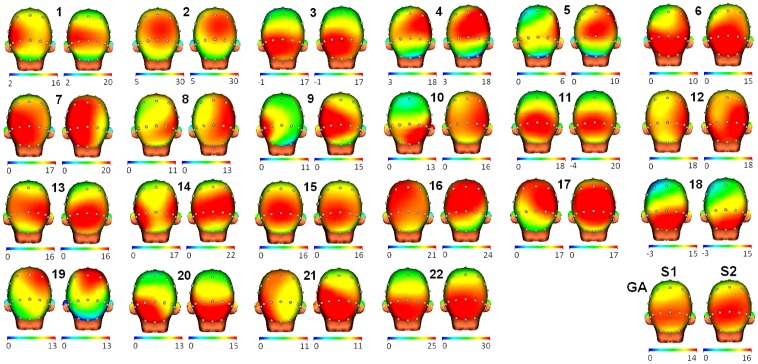
Figure 3. 3D head maps for each subject in both sessions.
Pairs of 3D head maps are displayed for each of the 22 subjects participating in the experiment and the grand average (GA). The left side of the pair is the P3 topography in session 1 and the right is for session 2. Note that the scale (in microvolts) has been adjusted for each subject between session 1 and 2 to show clearly the general increase in P3 amplitude for session 2 and the similar topography among sessions.

