
Fig. 1. Effect of growth phase on RcGTA recipient capability and adsorption.
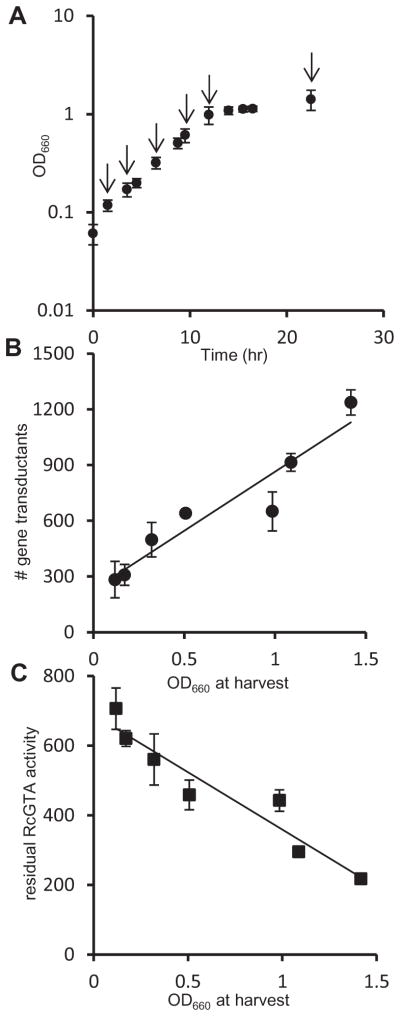
A. Growth curve of R. capsulatus B10 culture used for recipient capability and adsorption experiments. Arrows indicate time points where samples were taken for recipient capability and adsorption experiments. Error bars represent the variation in OD660 between two duplicate cultures.
B. Number of rifampicin-resistant colonies obtained in a transduction assay using equal numbers of cells at different phases of growth as recipients for RcGTA. Error bars represent the variation between two samples (one sample from each culture).
C. RcGTA adsorption to cells at different growth phases. The vertical axis shows the number of rifampicin-resistant colonies derived from an adsorption assay (see Experimental procedures), and the error bars represent the variation between two samples (one sample from each culture). A statistical correlation analysis of the data in Fig. 1B and C is given in Table S2.