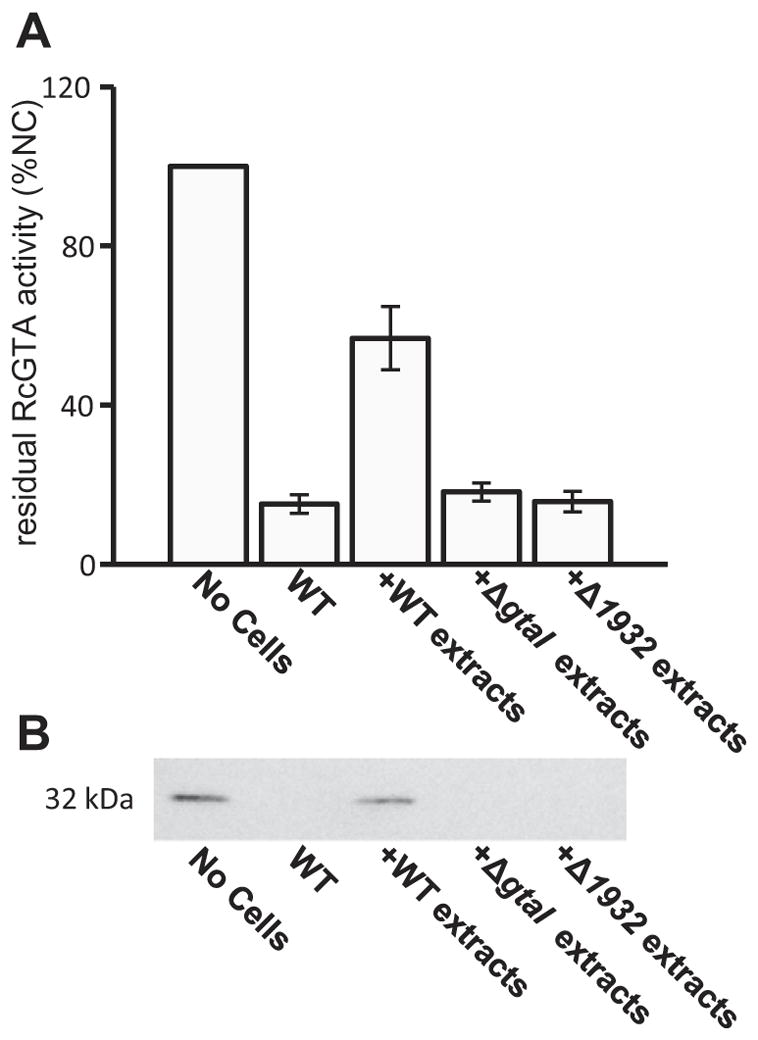
Fig. 7. Inhibition of RcGTA adsorption by addition of cell surface extracts.

A. Relative amount of transduction-proficient RcGTA present after an adsorption assay, with cell surface extracts added to the reaction mixture where indicated; No Cells denotes a control, in which RcGTA was added directly to recipient cells; WT indicates the addition of WT B10 cells to RcGTA before removal of cells by filtration and use of the RcGTA-containing filtrate for gene transduction; +WT extracts denotes the addition of cell surface extracts of WT B10 cells to RcGTA before removal of cells by filtration and use of the RcGTA-containing filtrate for transduction; +ΔgtaI extracts, and +Δ1932 extracts denote adsorption assays where cell surface extracts from each indicated strain were added to the transduction mixture (containing WT B10 cells). Adsorption values were measured by the amount of residual RcGTA in the filtrate (values are presented as a percentage of the number of RifR transductants obtained in the control where no cells were added to the reaction mixture).
B. Western blot of cells treated as described in (A), and probed with capsid antiserum. Statistical analysis was done by One-Way ANOVA, given in Table S7.
