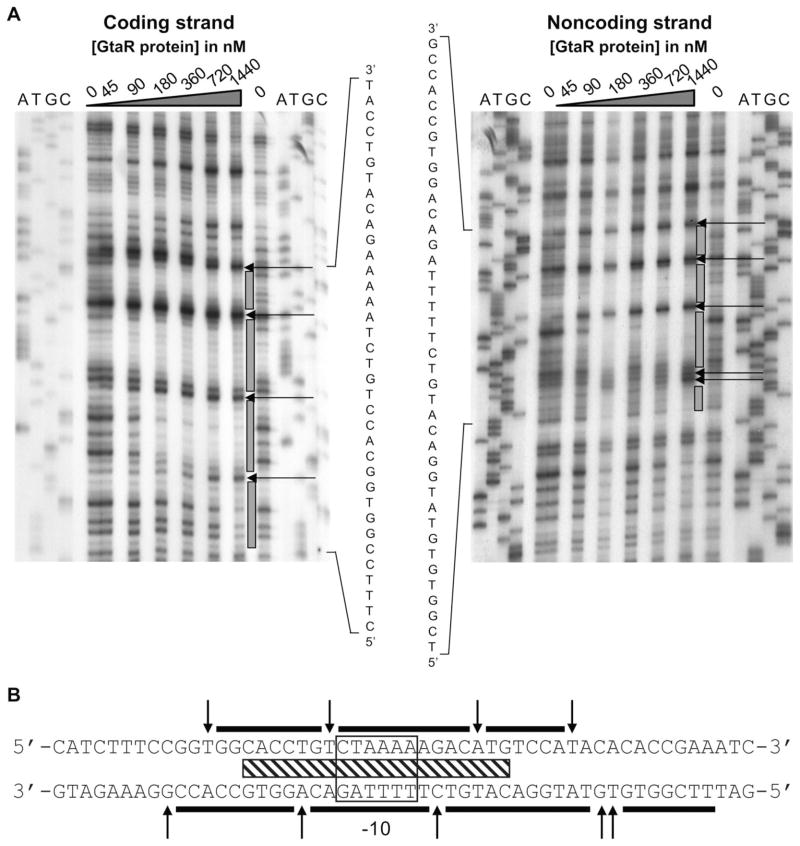
Fig. 5.
DNase I footprint analysis of the interaction between GtaR-6xHis and the gtaR promoter region.
A. Labelled DNA fragments were incubated with different concentrations of GtaR-6xHis as indicated above the autoradiograms. ATGC designate DNA-sequencing lanes, grey bars indicate the limits of protection, and arrows indicate bases that were hypersensitive to DNase I.
B. Sequence of the DNA protected by GtaR-6xHis. The black bars indicate the limits of protection, the predicted −10 region is boxed, and the hatched bar shows the position of the sequences similar to lux boxes (Table S1). The arrows indicate bases that were hypersensitive to DNase I.

