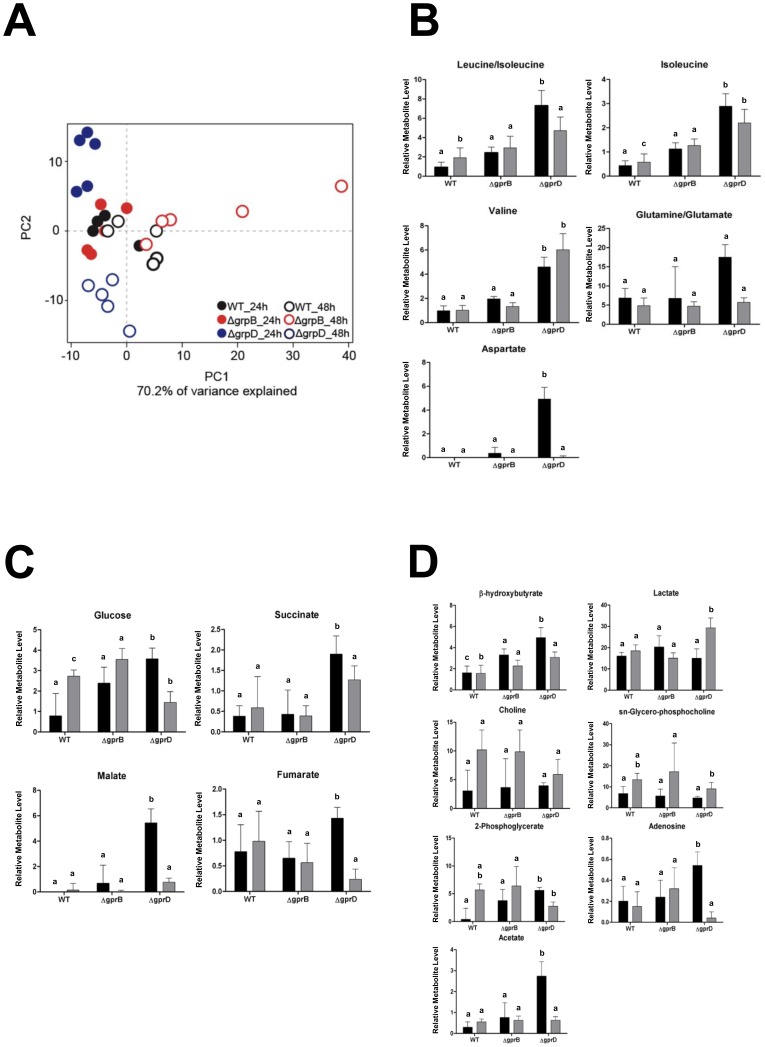
Figure 6. The metabolome of A. nidulans ΔgprB and ΔgprB strains grown on glucose.
(A) PCA plot illustrating the variance of the integrals from NMR spectral data for all strains collected at 24 or 48 hours. (B–D) Column charts for identified metabolites expressed in Relative Metabolite Levels (Calculated taking Log2 of molar ratios from integrated spectral data). Metabolite levels were measured and averaged for each strain after 24 hours of growth (black) and 48 hours of growth (light grey). Using a two-way ANOVA, at 24 hours P<0.001 was determined for leucine/isoleucine, valine, isoleucine, β-hydroxybutyrate, acetate, malate, and aspartate, P<0.05 was determined for glucose. At 48 hours, P<0.001 was determined for valine and glucose, P<0.01 was determined for isoleucine and lactate, P<0.05 was determined for leucine/isoleucine and β-hydroxybutyrate. The columns not sharing the same letter are significantly different from strains within their time of collection (Tukey HSD, p<0.05).

