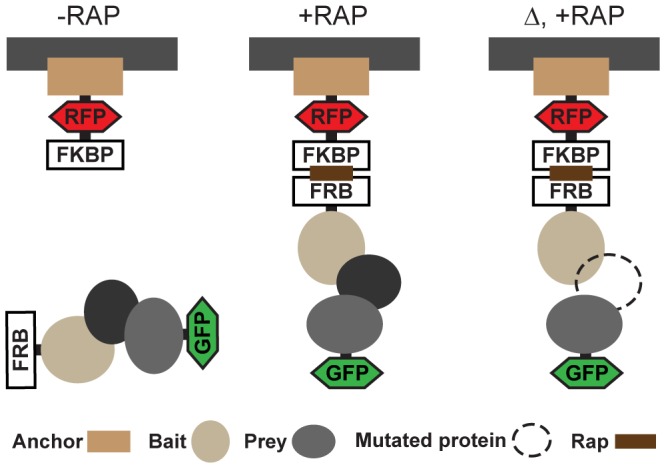
Figure 1. Representation of PICT approach.

Schematic representation of the assay. “−RAP” cells were treated with the vehicle; “+RAP” cells were treated with rapamycin; “Δ, +RAP” denotes that a gene has been deleted and the cells have been treated with rapamycin.
