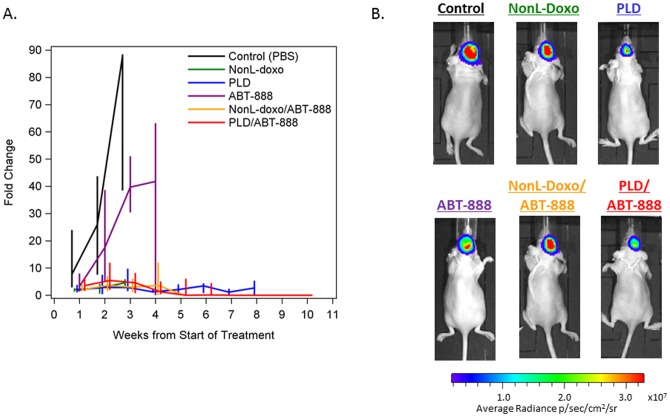
Figure 5. Bioluminescence imaging of TNBC intracranial tumor model.
(A) Dynamic changes in intracranial tumor growth after treatment as measured by bioluminescence imaging in photons/second. Groups are as follows: Control (black), non-liposomal doxorubicin (NonL-doxo, green), PEGylated liposomal doxorubicin [PLD] (blue), ABT-888 (purple), NonL-doxo/ABT-888 (yellow) and PLD/ABT-888 (red). The median fold changes are connected over time for each treatment group. The vertical bars indicate the interquartile rages (25th–75th percentiles). Points are only plotted when there were at least 2 animals in a treatment group. (B) Representative images of intracranial bioluminescence by treatment group 14 days post-treatment initiation.

