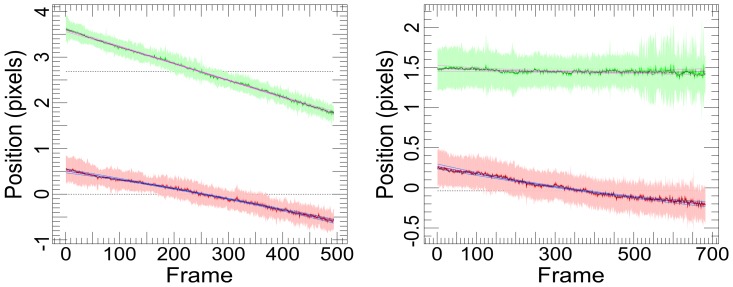
Figure 2. Examples of observed large (left) and small (right) sample drifts.
The plots show a combined aligned track for the drift in position (pixels) in X (solid red line) and Y (solid green line) from all tracks in a set of images. The fitted global drift of the sample, a quadratic model fitted using ordinary least squares, is shown as a blue line for X and lilac for Y.

