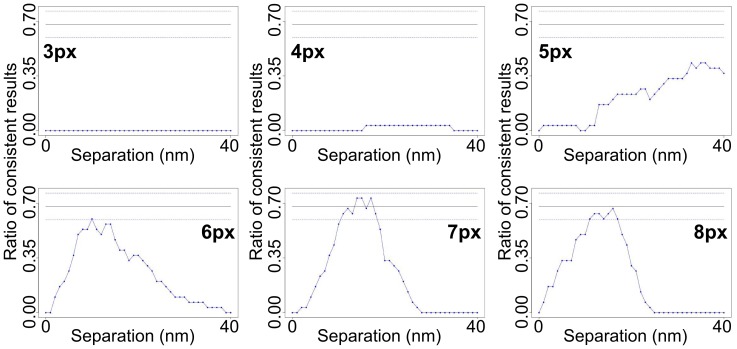
Figure 4. How close a second spot can be without affecting the calculated separation.
Simulations to determine how close, using distances in the range 3–8 pixels (as indicated to the left or right of each plot), a second spot can be before it affects the calculated separation within the first spot. If it is closer than 7 pixels (FWHM of the spot is 3 pixels), the separation is miscalculated and the percentage of consistent measurements does not reach 68%. Each plot shows data from 30 tracks. The simulated separation is 13 nm.

