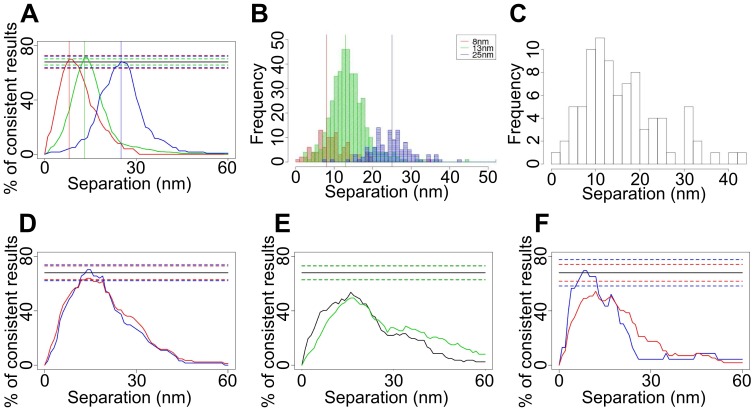
Figure 7. Population-averaged single-distance separations.
(A) 1sCI-Plots for simulated separations of 8 nm (red), 13 nm (green) and 25 nm (blue). The true distances are indicated by vertical lines. (B) Histogram of best fits for the 8, 13 and 25 nm simulated data. The calculated separation values from the best fits are 9.6±0.5 nm, 13.9±0.3 nm and 25.1 nm (C) Histogram of best fits and (D) 1sCI-Plots for the 13.3 nm DNA ruler data showing data sets where the root mean square of the residuals from fitting to the drift model exceeded 0.04 pixels (6.4 nm) were included (red) and excluded (blue). (E) 1sCI-Plots for end-to-end distance measurements of 8 nm (black) and 13.3 nm (green) DNA rulers without drift correction. The drift of the sample as a whole makes the distance appear larger and less defined. (F) 8 nm DNA rulers, showing data sets where the root mean square of the residuals from fitting to the drift model exceeded 0.04 pixels (6.4 nm) were included (red) and excluded (blue).

