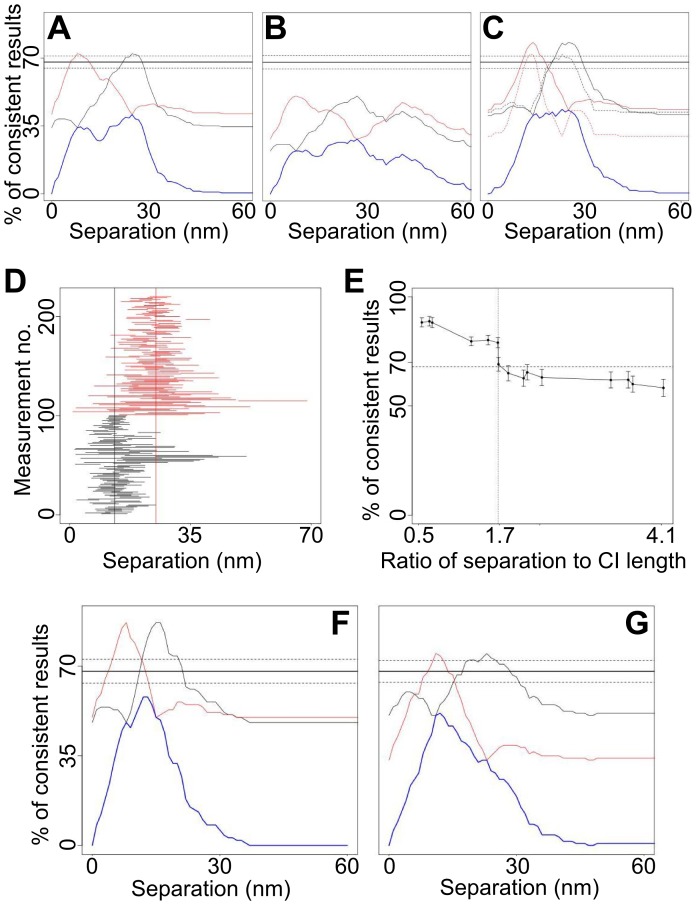
Figure 8. Multiple-distance separations.
(A) 1sCI-Plots (blue) and cross-sections through the 2sCI-Plots (black and red cross-sections, as shown in Fig. 6C) for mixes of simulated datasets with 8 and 25 nm separations. (B) Same as (A) for mixes of 8, 25 and 45 nm separations. (C) Same as (A) for mixes of 13 and 25 nm separations. The solid and dotted lines in correspond to all data and data with CI ≤7 nm respectively. (D) CIs of the simulated mixed 13 nm (black) and 25 nm (red) separations. The six marks show some confidence intervals that miss the correct separation, but hit the other separation. These false positives mean more CIs than expected seem to agree with the 13 nm-25 nm separation pair and the peaks in Fig. 8C exceed 68%. CIs that contain both separations are true positives. (E) Relation between the average CI length and the resolution. For different pairs of distances in simulated data sets, the maximal percentage of consistent measurements in the 2sCI-Plot is plotted against the ratio of separation to CI length. If the separation of the two distances is small compared to the length of the confidence intervals the CI-Plot has high peaks, indicating that the distances could not be resolved. If the separation between the two distances is larger than 1.7 times the average CI length, then the CI-Plot shows a maximum of around 68% consistent measurements. That indicates that the distances could be resolved. (F) 1sCI-Plots (blue) and cross-sections through the 2sCI-Plots (black and red) for mixes of simulated datasets 8 and 13 nm separations and (G) 8, 13 and 25 nm separations. The numbers of datasets with 8, 13, 25 and 45 nm separation were 100, 420, 120 and 60 respectively.

