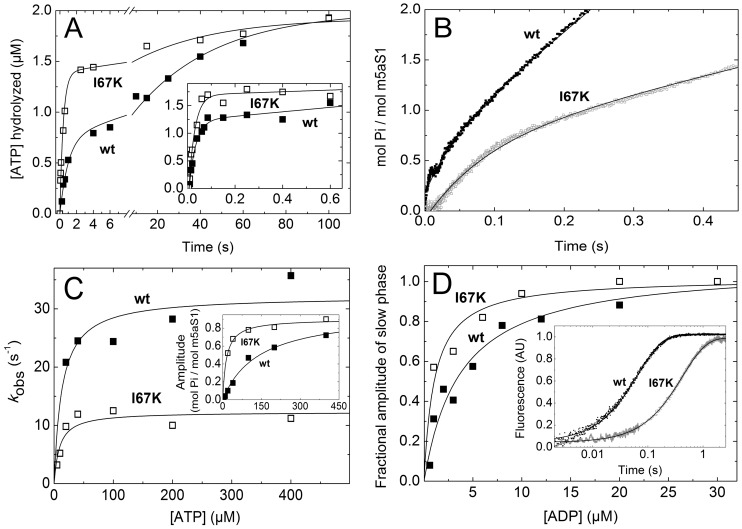
Figure 3. ATP hydrolysis and Pi release remain rapid and non-rate-limiting, but actin-activation of ADP release is abolished in I67K-m5aS1.
A, Main panel: Single-turnover ATP hydrolysis profiles obtained on mixing 3.5 µM wt-m5aS1 (solid squares) or I67K-m5aS1 (open squares) with 2 µM γ-32P-ATP in the quenched-flow apparatus. Double exponential fits to datasets shown yielded k obs values of 1.1 s−1 (37% fractional amplitude; limited by K 1 k 2) and 0.026 s−1 (limited by k 4) for wt-m5aS1, and 2.2 s−1 (71% fractional amplitude) and 0.026 s−1 for I67K-m5aS1. Data for wt-m5aS1 were taken from [17]. Inset: Multiple-turnover ATP hydrolysis profiles obtained on mixing 3 µM wt-m5aS1 (solid squares) or I67K-m5aS1 (open squares) with 30 µM γ-32P-ATP in the quenched-flow apparatus. In the datasets shown, the rapid exponential burst had k obs values (limited by K 1 k 2) of 35 s−1 and 39 s−1 with amplitudes of 1.2 µM (0.40 mol Pi/mol m5aS1) and 1.7 µM (0.57 mol Pi/mol m5aS1) for wt-m5aS1 and I67K-m5aS1, respectively. The slope of the linear steady-state phase (limited by k 4) was 0.13 s−1 and 0.050 s−1 for wt-m5aS1 and I67K-m5aS1, respectively. K 3 equilibrium constants were calculated from amplitude data as described in the text. B, Kinetic traces of Pi release (monitored by MDCC-PBP fluorescence) recorded on mixing 0.5 µM wt-m5aS1 (black trace) or I67K-m5aS1 (gray trace) plus 10 µM actin with 100 µM ATP in the stopped-flow apparatus. The wt-m5aS1 trace shown contained an exponential rapid burst with a k obs of 24 s−1 and an amplitude of 0.44 mol Pi/mol m5aS1, and a linear steady-state phase with a slope of 5.8 s−1. In the I67K-m5aS1 trace shown, the burst had a k obs of 11 s−1 and an amplitude of 0.74 mol Pi/mol m5aS1, and the steady-state slope was 1.7 s−1. C, ATP concentration dependence of k obs (main panel) and amplitudes (inset) of the rapid burst in experiments performed as in B (solid squares, wt-m5aS1; open squares, I67K-m5aS1). Hyperbolic fits to k obs datasets yielded maximal rate constants (k max ≤ k 4’) of 32 and 12 s−1, with half-saturation at 13 and 9.1 µM ATP for wt-m5aS1 and I67K-m5aS1, respectively. Hyperbolic fits to the amplitude datasets yielded maximal amplitudes of 0.99 and 0.90 mol Pi/mol m5aS1 with half-saturation at 140 and 14 µM ATP for wt-m5aS1 and I67K-m5aS1, respectively. D, ADP release kinetics and ADP affinity of acto-m5aS1 monitored using PA fluorescence. Main panel, ADP concentration dependence of the fractional amplitudes of the slow phase of biphasic PA fluorescence transients recorded on rapidly mixing a premixture of 0.5 µM wt-m5aS1 (solid squares) or I67K-m5aS1 (open squares), 0.7 µM PA and the indicated ADP concentrations with 200 µM ATP in the stopped-flow apparatus (pre-mixing concentrations). In these conditions, the rapid and slow phases represented ATP-induced dissociation of the nucleotide-free and initially ADP-bound acto-m5aS1 fractions, respectively. In the case of the ADP-bound fraction, ADP release (k 5’) limited the k obs of acto-m5aS1 dissociation. Hyperbolic fits to the datasets yielded K 5’ values of 3.7 and 1.0 µM for wt-m5aS1 and I67K-m5aS1, respectively. Inset: Representative transients obtained at a quasi-saturating ADP concentration (20 µM). The dominant slow phase had k obs ( = k 5’) values of 14 s−1 and 2.4 s−1 in wt-m5aS1 (black trace) and I67K-m5aS1 (gray trace), respectively.

