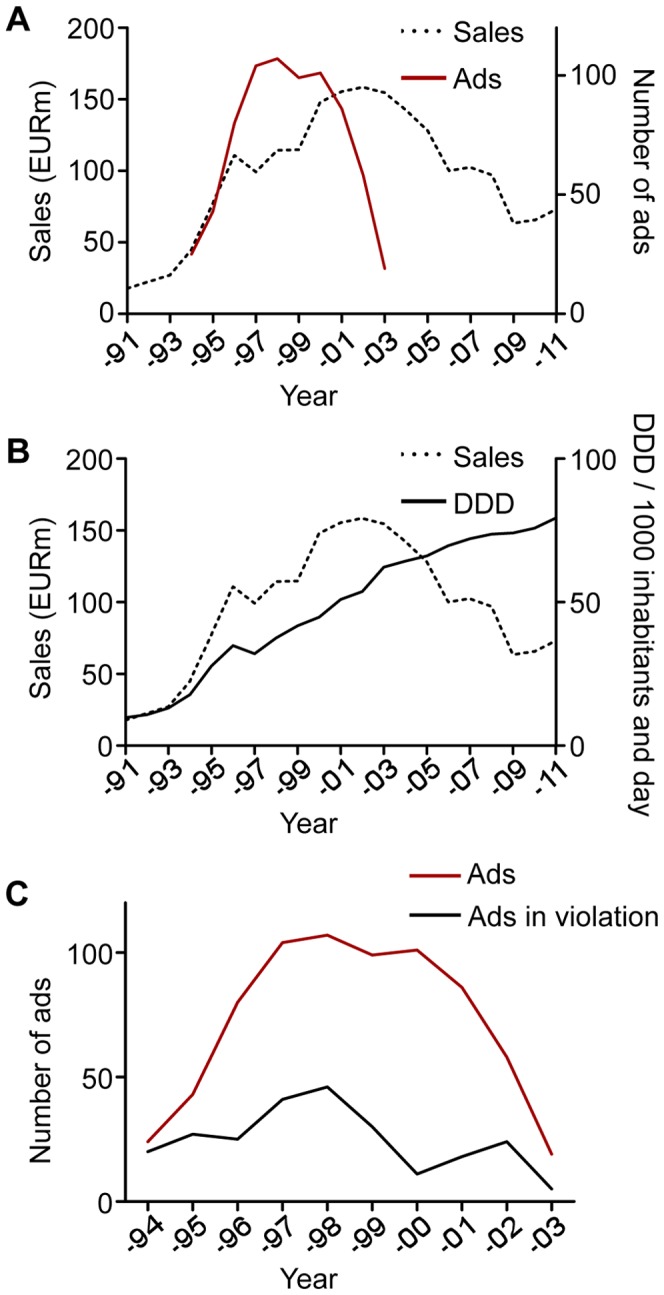
Figure 2. Antidepressant sales in Sweden and advertising dynamics in the Swedish Medical Journal.

(A) Graphs show antidepressant sales (in EUR million) (dotted line) in Sweden in 1991–2011 and total antidepressant advertisements (red unbroken line) in the Swedish Medical Journal in 1994–2003. Spending on antidepressants rose steeply between 1993 and 1996, as well as between 1999 and 2001, but subsequently plateaued and started falling, coinciding with a drop in antidepressant advertising. (B) Declining antidepressant spending (dotted line) and advertising did not coincide with a drop in prescriptions (unbroken line), but instead coincided with price cuts due to major patent expiries. (C) Graphs show total (red line) and violative (black line) antidepressant advertising in the Swedish Medical Journal in 1994–2003.
