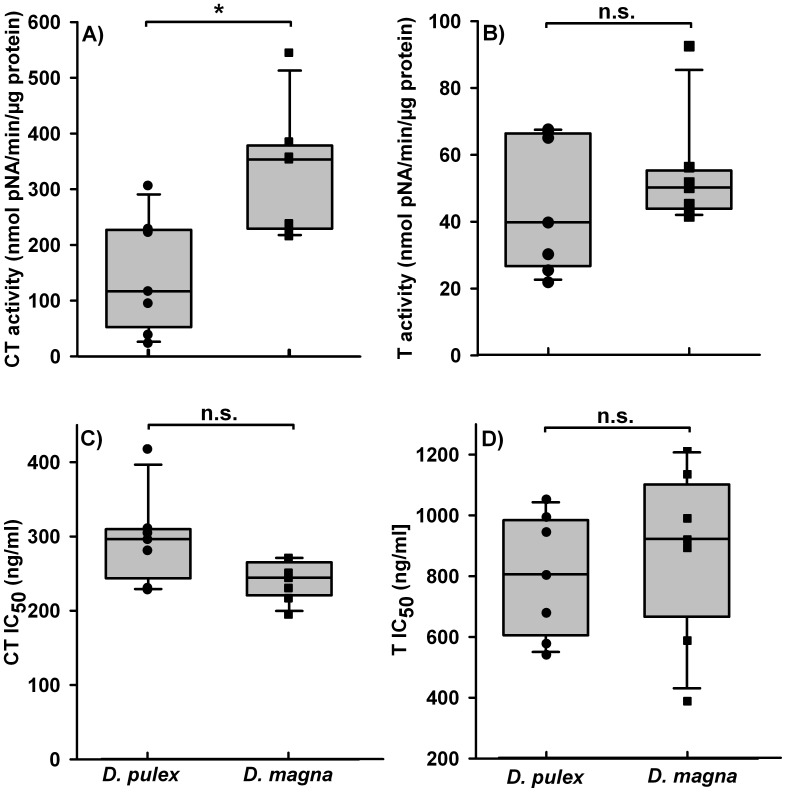
Figure 2. Sensitivity and specific activity of trypsins and chymotrypsins of each Daphnia clone.
Box plots showing two possible causes for the observed differences in the tolerance of D. magna and D. pulex to cyanobacteria with protease inhibitors were tested: (a) specific chymotrypsin (CT) and (b) trypsin (T) activity of the D. pulex (circles) and D. magna clones (squares). Inhibition of digestive proteases from homogenates of clones of D. pulex (circles) and D. magna (squares): (c) effects of extracts of M. aeruginosa strain NIVA on chymotrypsins, and (d) effects of extracts of M. aeruginosa strain PCC− on trypsins. Depicted are IC50 values, which represent the concentration of extracted dry weight of cyanobacterial biomass that is required to cause a 50% inhibition of respective proteases. Low IC50 values indicate a high sensitivity of proteases from the respective Daphnia clones. Medians are denoted by solid black lines, while the top and bottom box edges denote the first and third quartile. Whiskers denote the largest and smallest data within 1.5 times the interquartile range. Significant differences (Student’s t-test, p<0.05) among species are indicated by an asterisk; no differences are labeled with “n.s.”.

