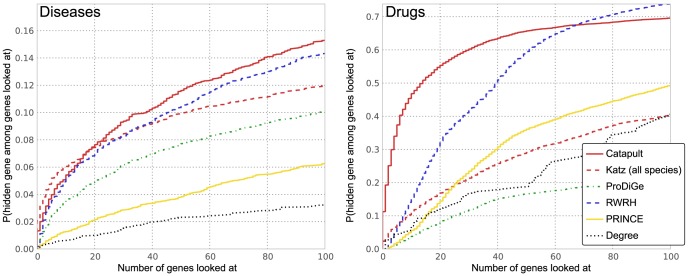
Figure 5. Precision-Recall curves for three-fold cross validation.
Left panel corresponds to evaluation of OMIM phenotypes, and the right corresponds to drug data. The vertical axis shows the precision rate, i.e. fraction of true positives in the top- predictions. The horizontal axis shows the recall rate, i.e. ratio of true positives recovered in the top-
 predictions to the total number of positives for a phenotype (or a drug) in the hidden set. The plots show precision-recall values at various thresholds
  , in the range
  and the value at a given
  is averaged over all the phenotypes (drugs). The plots use the same experimental setup as in Figure 4, and we observe that the comparisons illustrated by precision-recall measure are consistent with the rank cdf measure in Figure 4.

