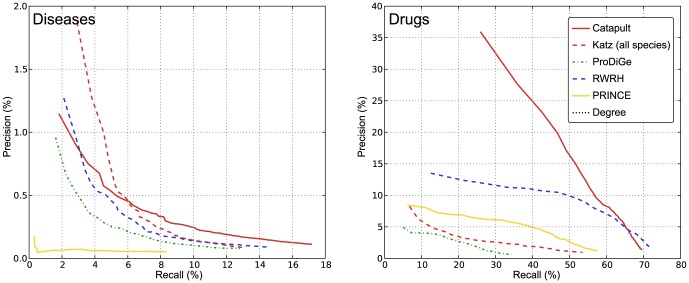
Figure 6. Empirical cumulative distribution function for the rank of withheld singleton genes.
Left panel corresponds to evaluation of OMIM phenotypes, and the right corresponds to drug data. The vertical axis shows the probability that a true gene association is retrieved in the top- predictions for a disease. The Katz and Catapult methods use all species information, and all the methods use the HumanNet gene network. PRINCE and RWRH are implemented as proposed in [7] and [8] respectively, but using the HumanNet gene network. The ProDiGe method is implemented as discussed in the Methods section. We have not included the degree based list from Figure 4, since all the singleton genes are always given degree 0 during cross-validation. Catapult (solid red) does much better than ProDiGe (the only other supervised method) but does worse compared to walk-based methods than in Figure 4 (that uses the same setting for all the methods). PRINCE and ProDiGe are consistent with (and sometimes perform slightly better than) the full cross-validation evaluation. RWRH and the Katz measure perform better than the supervised learning methods ProDiGe and Catapult in this evaluation scheme. The fact that PRINCE performs so well on singletons in the drug data case is surprising, given that the only information it uses is the HumanNet gene network.

