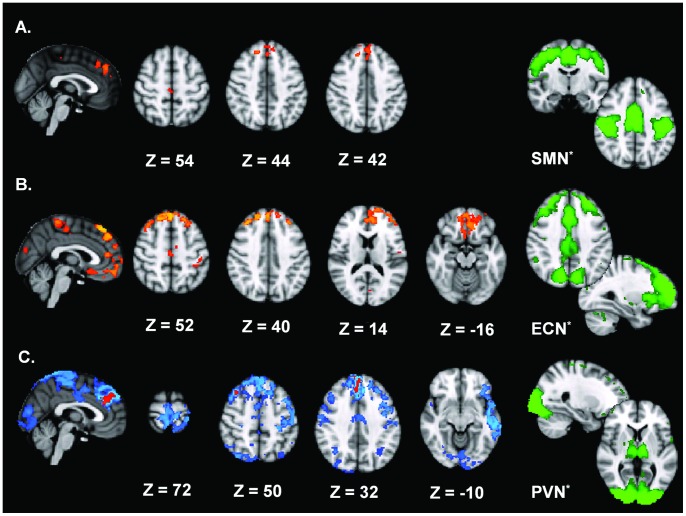
Figure 1. Between-group effects for the SMN, ECN and PVN.
Depicted here are the between-group effects for three RSNs. Between-group effects are corrected for family-wise errors (p≤0.013 for A. and B.; p≤0.05 (blue) and p≤0.013 (orange) for C.). A. shows frontal regions and precentral regions abnormally connected to the SMN, indicating decreased connectivity within the CD group. B. shows brain regions linked to the ECN, exhibiting increased connectivity for the CD group. C. The PVN shows CD-related decreased connectivity of several regions including PFC, PMC, SM1, and visual and temporal areas. *The right column (green) shows the original RSNs used in the dual regression approach, thresholded at Z = 2,0. These are PICA spatial maps of healthy subjects derived from Smith et al. [22] Images are t-statistics overlaid on the MNI-152 standard brain. The left hemisphere of the brain corresponds to the right side in this image.

