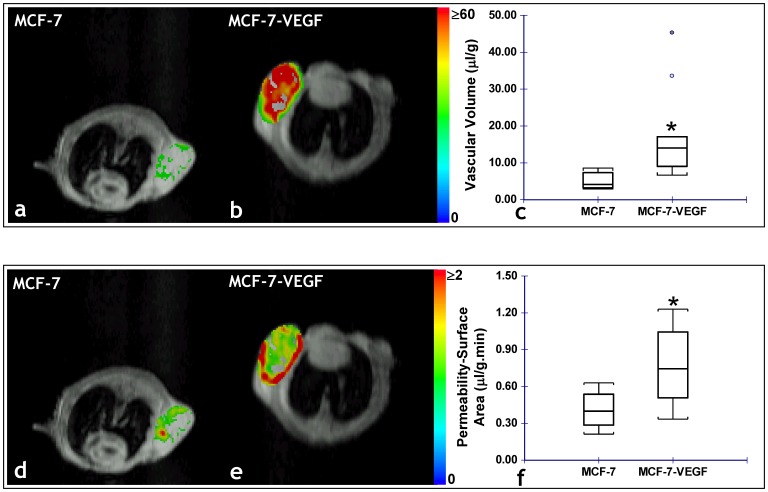
Figure 3. In vivo MRI reveals VEGF overexpression alters the angiogenic phenotype of MCF-7 tumors.
Representative functional MRI maps of the vascular volume from: (a) MCF-7 and (b) MCF-7 VEGF overexpressing tumor bearing animals. (c) Box-and-whisker plot comparing the vascular volume between MCF-7 (n = 10) and MCF-7-VEGF (n = 12) xenografts. The length of each box is the interquartile range (IQR), while the line through the middle of each box is the median value. The T-shaped lines extending from each end of the box represent the upper adjacent value (i.e. the largest observation ≤ 75th percentile+1.5×IQR) and the lower adjacent value (i.e. the smallest observation ≤ 25th percentile–1.5×IQR), and gray dots denote values outside this range (*p = 0.000059 with the two-tailed Mann-Whitney U Test). Representative functional MRI maps of the permeability-surface area product from: (d) MCF-7 and (e) MCF-7 VEGF overexpressing tumor-bearing animals. (f) Box-and-whisker plot comparing the permeability-surface area product between MCF-7 (n = 10) and MCF-7-VEGF (n = 12) xenografts (*p = 0.0026 with the two-tailed Mann-Whitney U Test).

