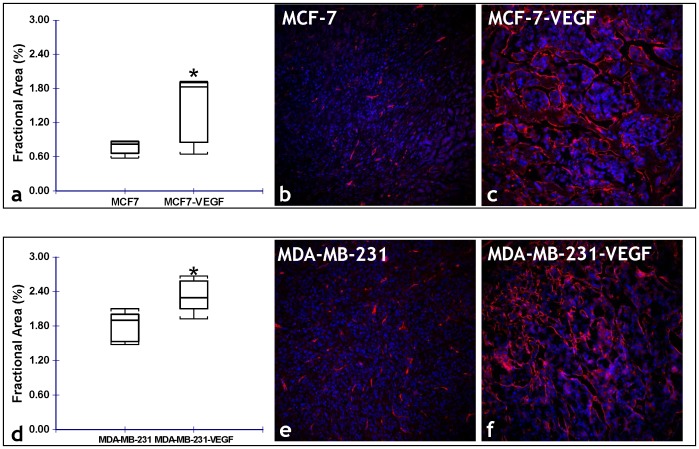
Figure 5. Immunofluorescent validation of VEGF-induced alterations in the angiogenic phenotype.
(a) Box-and-whisker plot comparing the stereologically assessed fractional blood vessel area between MCF-7 and MCF-7-VEGF xenografts (*p = 0.0476 with the one-tailed Mann-Whitney U Test). Representative fluorescence (CD34-red, DAPI-blue) photomicrographs (20×) from: (b) MCF-7, and (c) MCF-7-VEGF tumor sections illustrating the difference in the fractional area of CD34 stained blood vessels. (d) Box-and-whisker plot comparing the stereologically assessed fractional vessel area between MDA-MB-231 and MDA-MB-231-VEGF xenografts (*p = 0.0012 with the one-tailed Mann-Whitney U Test). Representative fluorescence (CD34-red, DAPI-blue) photomicrographs (20×) from: (b) MDA-MB-231, and (c) MDA-MB-231-VEGF tumor sections illustrating the difference in the fractional area of CD34 stained blood vessels.

