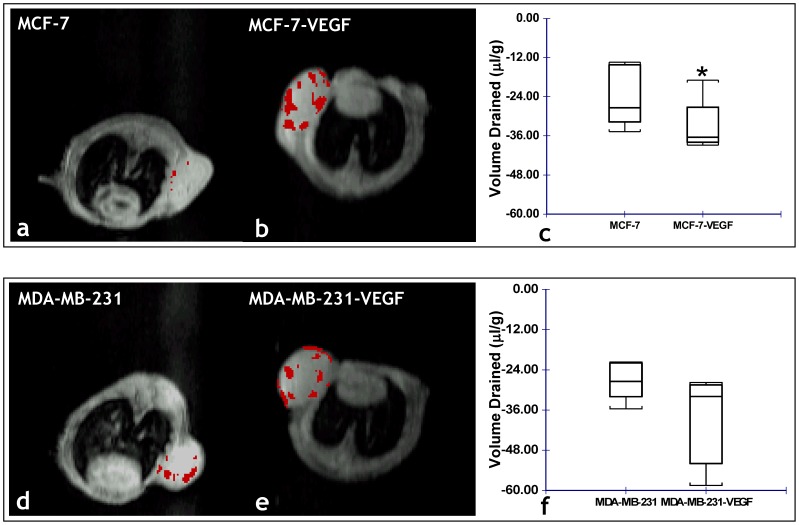
Figure 6. In vivo MRI reveals VEGF overexpression alters the ECM of MCF-7 tumors.
Representative functional MRI maps of the volume of extravascular fluid drained from: (a) MCF-7 and (b) MCF-7-VEGF overexpressing tumor xenografts. (c) Box-and-whisker plot comparing the volume drained between MCF-7 (n = 5) and MCF-7-VEGF (n = 5) xenografts (*p = 0.0277 with the one-tailed Mann-Whitney U Test). Representative functional MRI maps of the volume of extravascular fluid drained from: (d) MDA-MB-231 and (e) MDA-MB-231-VEGF overexpressing tumor xenografts. (f) Box-and-whisker plot comparing the volume drained between MDA-MB-231 (n = 5) and MDA-MB-23-VEGF (n = 4) xenografts.

