
Figure 1. Comparison of the composition of the fecal microbial communities of each sample using the Jaccard similarity coefficient.
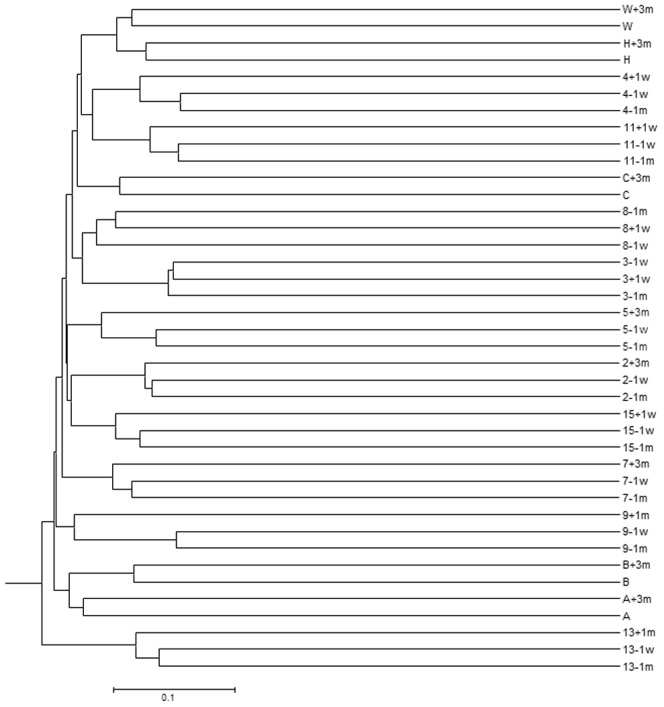
Distances between communities, based on the presence and absence of 16S rRNA sequences, were calculated with the Jaccard coefficient (jclass) within Mothur and clustered using the UPGMA algorithim. The first numeral/letter (subjects that underwent colonoscopy/subjects who did not) corresponds to the subject, the last numeral indicates when the sample was obtained. For subjects who underwent colonoscopy: −1m, −1w, sample obtained one month, one week pre-colonoscopy, +1w, +1m, +3m, sample obtained 1 week, one month, or 3–6 months post-colonoscopy, respectively. For subjects who did not undergo colonoscopy: +3m, sample obtained 3–6 months after the first sample.