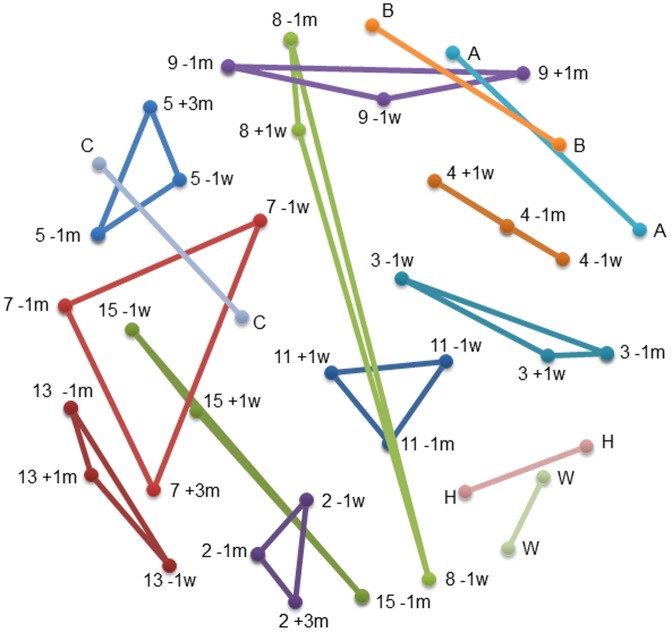
Figure 2. NMDS plot of the microbial communities of subjects’ samples using a distance matrix calculated with the Jaccard similarity coefficient.
The plot of the two NMDS axes was generated using a distance matrix calculated at the 3% level, with the Jaccard similarity coefficient within Mothur for all samples. The distance between two points is directly proportional to the Jaccard similarity value for two samples such that sites positioned close together share more OTUs than samples further apart. NMDS stress = 0.15. Refer to Figure 1 legend for sample labelling.

