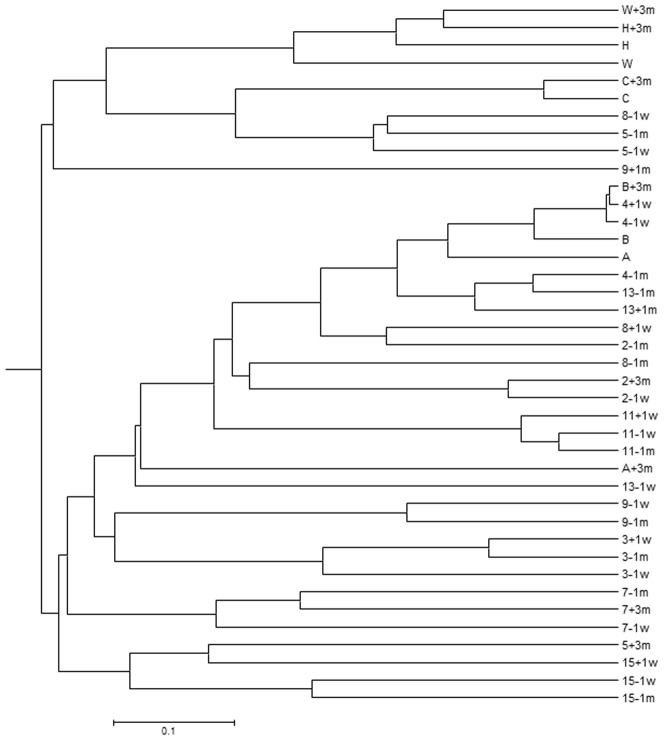
Figure 3. Comparison of the relative abundance of fecal microbial communities of each sample using the Yue and Clayton theta measure of dissimilarity.
Dissimilarity between the relative abundance of communities was calculated with the Yue and Clayton measure of dissimilarity within Mothur and clustering performed using the UPGMA algorithm. The first numeral/letter indicates the patient or control, the last numeral indicates when the sample was obtained. Refer to Figure 1 legend for sample labelling.

