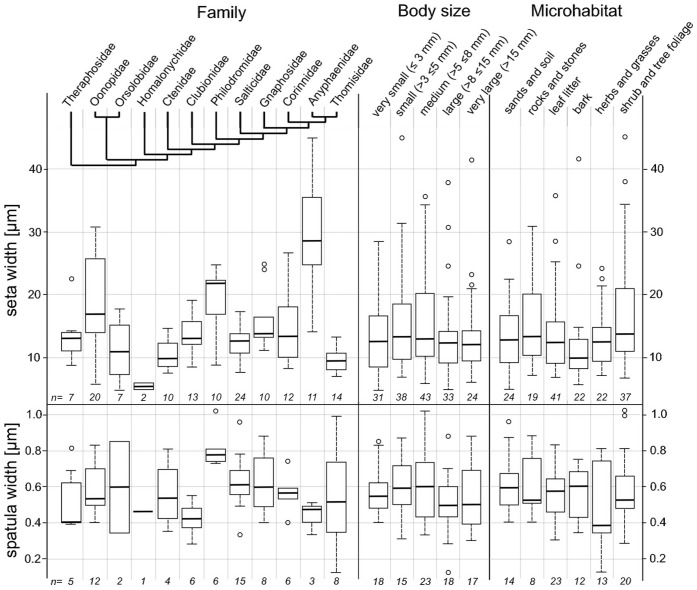
Figure 5. Body size and preferred microhabitat.
Box plots showing the 25th and 75th percentiles and the median line; error bars define the 1.5 times interquartile range; rest values are marked by single circles. Numbers at the bottom give the species numbers sampled (each including the mean width of ten randomly chosen setae/spatulae of the distal part of the claw tuft). Seta width differs significantly between species of different families (Kruskal-Wallis rank sum test: p = 0.000), but not between differently sized (p = 0.155) and ecological groups (p = 0.102) of the overall sample. The same holds for spatula size (families: p = 0.030; size = 0.377; microhabitat = 0.860).

