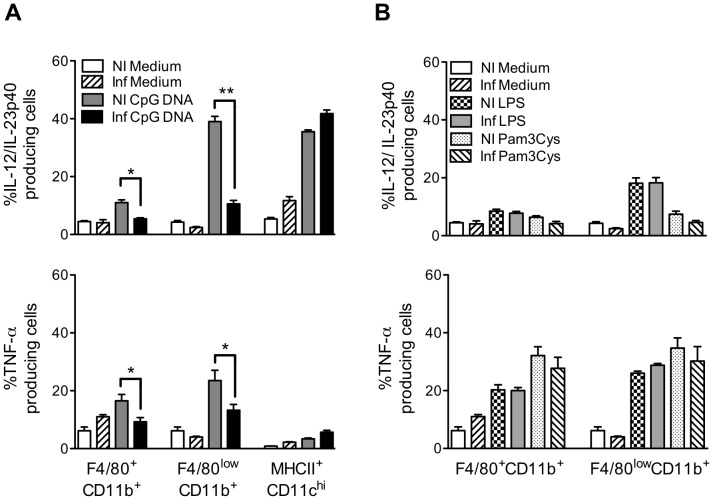
Figure 5. Comparison of the capacity of F4/80+CD11b+, F4/80lowCD11b+ and MHCII+CD11chigh populations to respond to TLR9 agonist during acute phase of T.cruzi infection.
Intracellular TNF-α and IL-12/IL-23p40 were analyzed by flow cytometry in spleen from C57BL/6 mice seven days post-infection. Splenic cells were cultured in medium alone, with CpG DNA (1 µg/ml), LPS (1 µg/ml) or Pam3Cys (1 µg/ml). (A) Frequencies of splenic TNF-α+ or IL-12/IL-23p40+ cells (F4/80+CD11b+, F4/80lowCD11b+ and MHCII+CD11chigh) after stimulation with CpG DNA (1 µg/ml) (mean ± SD of four mice) or (B) frequencies of splenic TNF-α+ or IL-12/IL-23p40+ cells (F4/80+CD11b+ and F4/80lowCD11b+) stimulated with LPS (1 µg/ml) or Pam3Cys (1 µg/ml) (mean ± SD of four mice) isolated from infected and non-infected mice. Data are representative of three independent experiments. *p<0.05 and **p<0.01 indicate statistical significance when comparing the percentage of the same cell population from infected or not infected mice cultured in the same conditions.

