
Figure 6. Expression level of TLR9 and TLR2 in spleen cells during the acute phase ofT. cruzi infection.
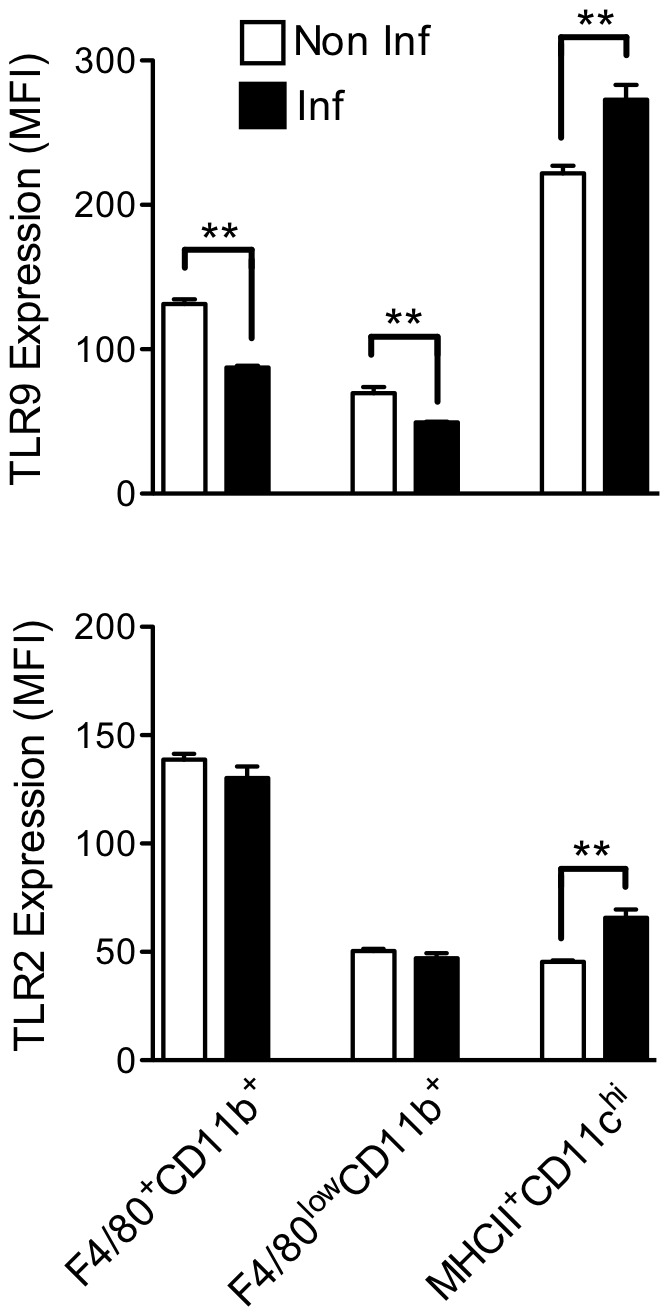
The mean fluorescent intensity (MFI) obtained by flow cytometry indicates the expression level of TLR9 and TLR2 in F4/80+CD11b+, F4/80lowCD11b+ and MHCII+CD11chigh from infected or non-infected C57BL/6 WT mice seven days post-infection. The data represent the mean of four mice (mean ± SD). **p<0.01 indicates statistical significance when comparing the MFI of the same cell population from infected versus non-infected C57BL/6 WT mice.