
Figure 4. Cardiac Sarcoplasmic Reticulum Calcium ATPase 2a (SERCA) activity and fatty acid composition.
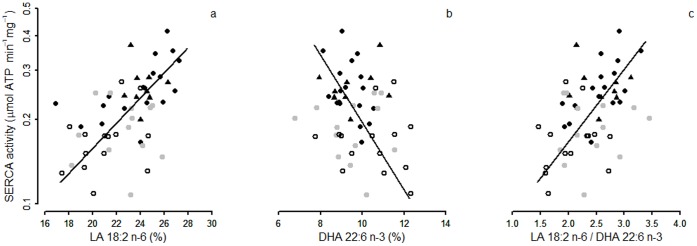
SERCA activity as a function of the proportions (% of total fatty acids) of (a) Linoleic acid (LA 18:2 n-6), (b) Docosahexanoic acid (DHA 22:6 n-3), and (c) the ratio of LA/DHA in the sarcoplasmic reticulum membrane. Black dots indicate data from torpid animals, black triangles from cooling animals, grey dots from animals during inter-bout arousals, and open dots from summer and non-hibernating winter animals (Difference of slopes between groups: (a) F = 1.78, p = 0.15; (b) F = 0.89, p = 0.48; (c) F = 2.07, p = 0.10; regression statistics for all 54 animals from linear ranged major axis analysis: (a) intercept = −1.70, slope = 0.05, adjusted R2 = 0.27, p<0.01; (b) intercept = 0.50, slope = −0.12, adjusted R2 = 0.04, p = 0.04; (c) intercept = −1.29, slope = 0.03, adjusted R2 = 0.18, p = 0.02).