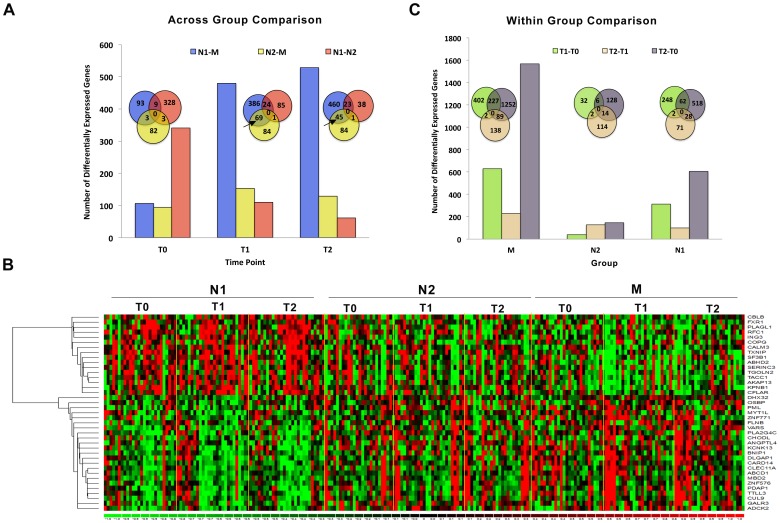
Figure 1. Individual gene-based differential expression analysis.
A) Differentially expressed genes identified by 3 across-group comparisons (N1 vs. N2, N1 vs. M, and N2 vs. M) at T0, T1 and T2. Venn diagrams depict the overlap of genes identified by these 3 comparisons at each time point. B) Heat map of genes that were significantly differentially expressed comparing N1 vs. N2 and N1 vs. M at T1 and T2 (marked with arrow in Venn diagrams). Gene expression is shown with a pseudocolor scale (−1 to 1) with red color denoting increased and green color denoting decreased fold change in gene expression. The rows represent the genes and columns represent subjects in N1, N2 and M groups at T0, T1 and T2. C) Differentially expressed genes identified by 3 within-group comparisons at different time points (T0 vs. T1, T0 vs. T2 and T1 vs. T2). Venn diagrams depict the overlap of genes identified by the 3 comparisons within each group.

