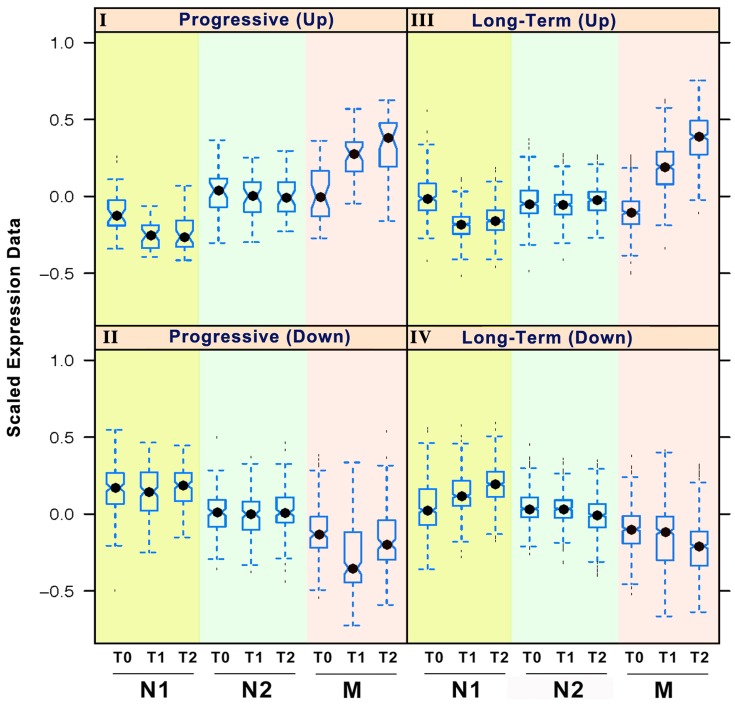
Figure 2. Temporal genomic expression patterns during one session of RR elicitation.
Genes that were differentially expressed either across or within groups comparisons at different time points were used as the seed set of genes for Self-Organizing Map (SOM) analysis. These differentially expressed genes were partitioned to 18 separate maps according to Pearson correlation coefficient based distance metrics (Figure S2). Selected biologically interesting SOM maps were manually clustered into 4 biologically relevant categories based on the gene expression of N1, N2 and M groups at the 3 time points in one session of RR elicitation: Long-term Downregulation; Long-term Upregulation; Progressive Upregulation; and Progressive Downregulation. One representative pattern for each of these 4 biologically relevant categories is shown in the figure. The figure displays the box plot of the gene expression with X-axis representing time points and groups, and Y-axis representing scaled gene expression data from −1 to +1.

