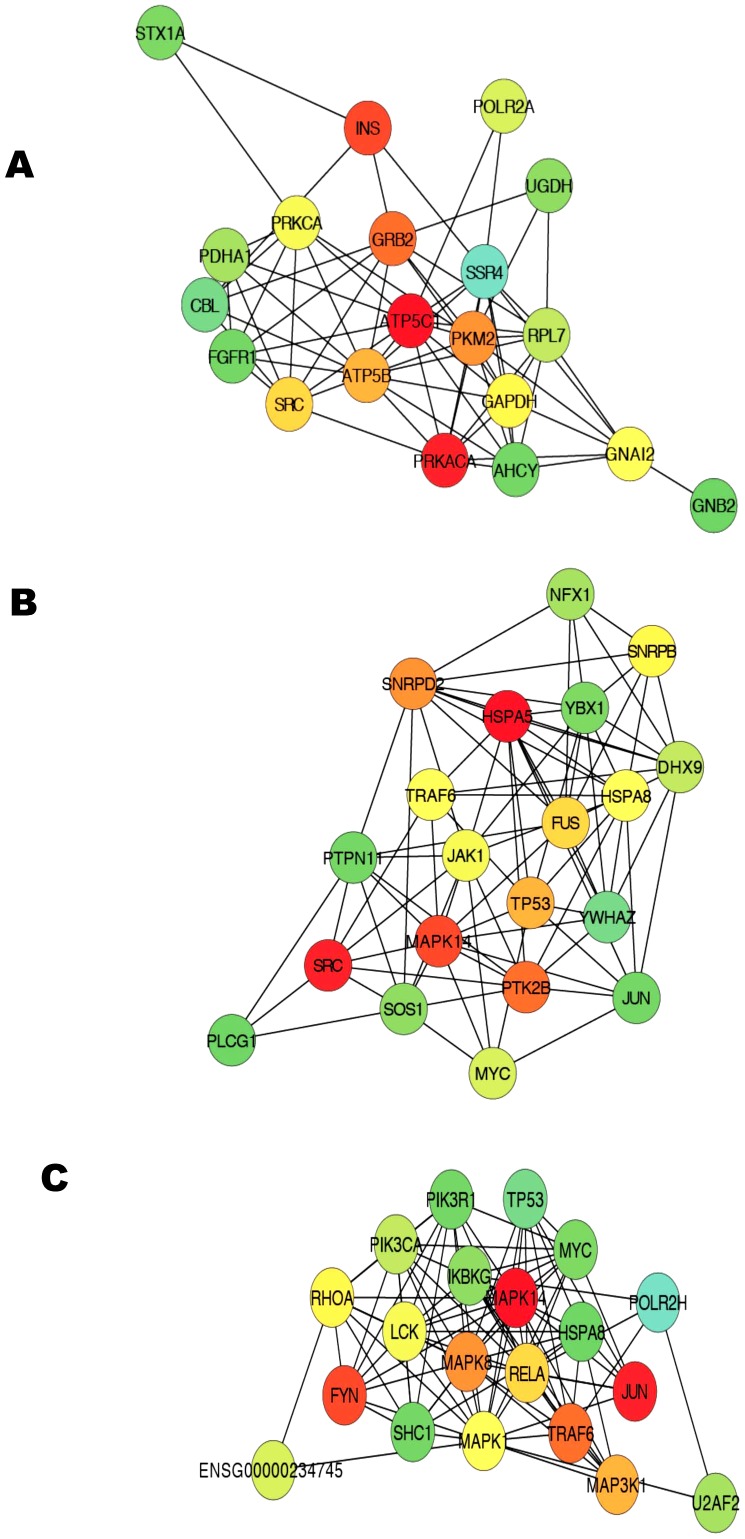
Figure 5. Interactive network and top focus gene hubs identified from significantly affected pathways.
The figure represents the top focus genes. A) Progressive upregulated Pathways, B) Progressive downregulated Pathways, and C) Integrated network of Long-term and Progressive affected pathways. The top focus hubs were identified from complex interactive networks generated from pathways with progressive and long-term patterns. The focus gene hubs were identified using the bottleneck algorithm for identification of the most interactive molecules with tree like topological structure. The bottleneck algorithm ranks genes on the basis of significance level with smaller rank indicating increasing confidence. The pseudocolor scale from red to green represents the bottleneck ranks from 1 to 20.

