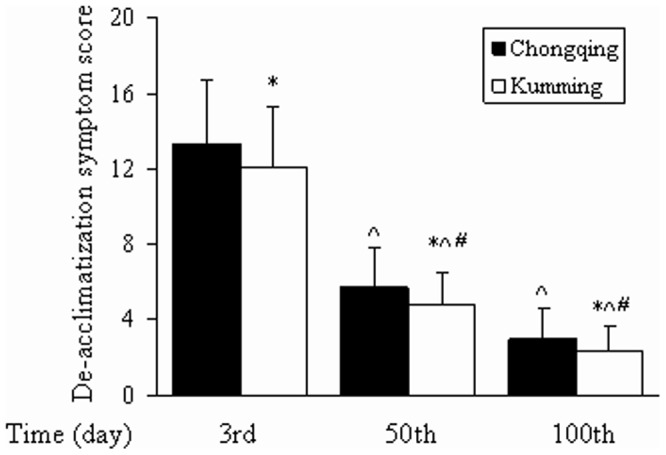
Figure 1. Symptom scores.

Data are presented as mean ± SD. *P<0.05, relative to the Chongqing group. ^P<0.05, relative to the 3rd day, # P<0.05, relative to the 50th day.

Data are presented as mean ± SD. *P<0.05, relative to the Chongqing group. ^P<0.05, relative to the 3rd day, # P<0.05, relative to the 50th day.