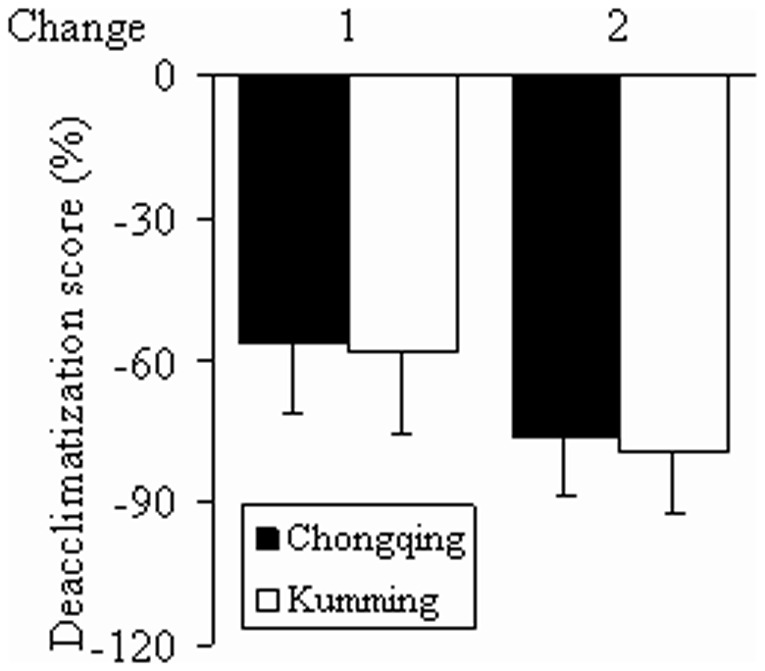
Figure 2. Rates of change in symptom scores.

Data are presented as mean ± SD. Symptom scores recorded on the 3rd day after return to low-altitude areas served as baseline values. Rate of change 1 = (score on 50th day-score on 3rd day)/score on 3rd day×100%; rate of change 2 = (score on 100th day-score on 3rd day)/score on 3rd day×100%. Rates of change 1 and 2 showed no significant difference between the Chongqing and Kunming groups (P>0.05).
