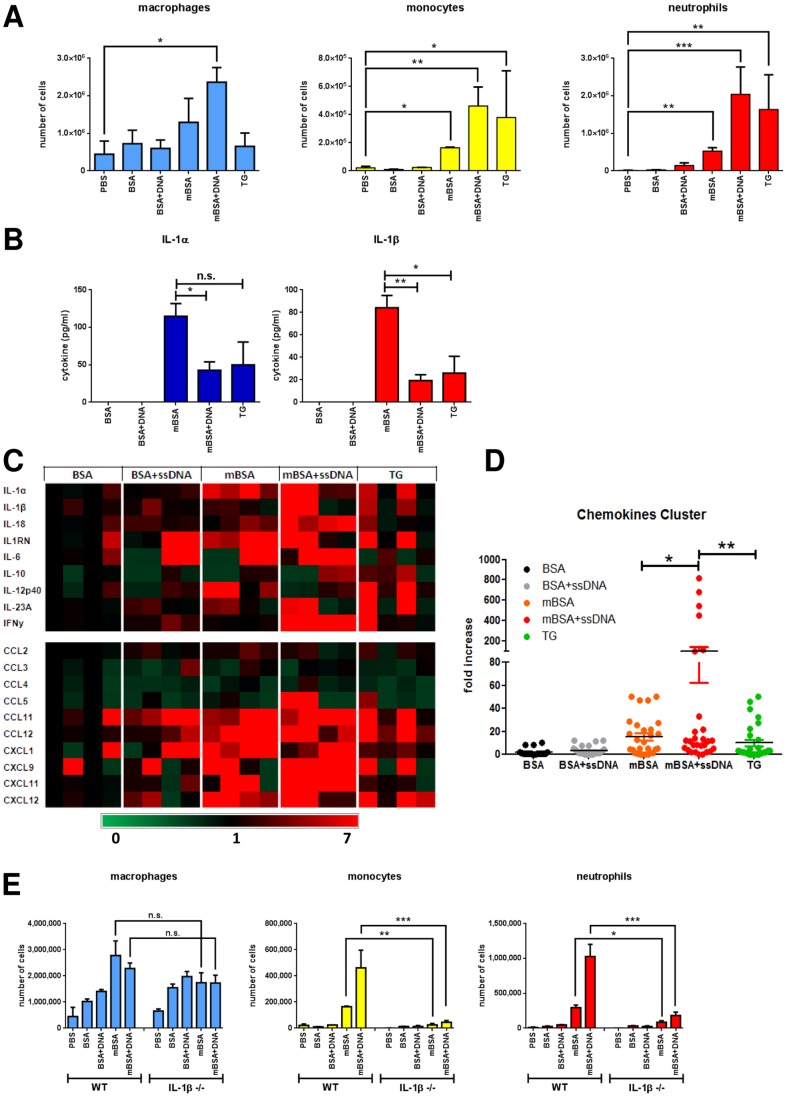
Figure 5. mBSA triggers inflammation in vivo.
(A) Numbers of infiltrating macrophages (left), monocytes (middle) and neutrophils (right) in the peritoneum of mice 4 h after i.p. injection of different stimuli. Error bars are means ± SD of 4 mice per group. *p<0.05, **p<0.005. (B) Levels of IL-1α (left) and IL-1β (right) secreted in the peritoneal lavages. *p<0.05. (C) Gene expression of peritoneal exudate cells presented as a heat map. One BSA-injected animal was used as a reference. Each block represents one mouse. (D) Plot of induced transcript expression of the chemokines from the bottom cluster of *p<0.05, **p<0.005. (C). (E) Numbers of infiltrating macrophages (left), monocytes (middle) and neutrophils (right) in the peritoneum of wild-type or IL-1β−/− mice 4 h after i.p. injection of different stimuli. Error bars are means ± SD of 3 mice per group. **p<0.005.

