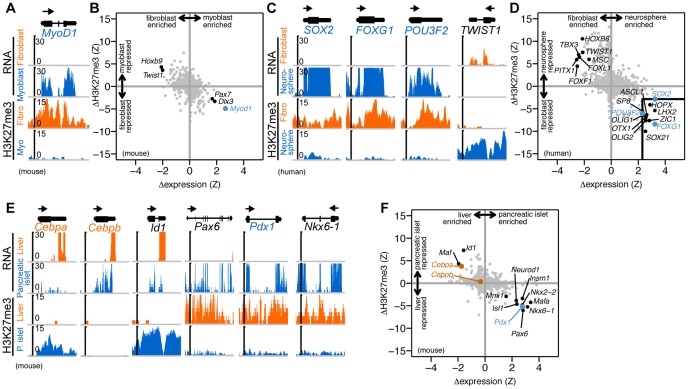
Figure 1. Transdifferentiation factors are more highly expressed in target cell types and more PcG repressed in source cell types.
(A) Gene expression and H3K27me3 histone modification levels as measured by RNA-seq and ChIP-seq, respectively, are shown for MyoD1, a factor that converts fibroblasts to myoblasts [12]. Reads are displayed (units of reads per ten million mapped reads) across the MyoD1 locus and 1 kb regions flanking the gene. The arrow above the gene structure denotes direction of transcription. Data from [55], [56]. (B) Differential expression and modification levels are shown for all transcription factors [15] (n = 1,356) annotated in the mouse genome (grey points), including MyoD1 (blue point). (C,D) Similar plots to (A,B) are shown for factors that convert fibroblast to neural stem cells (SOX2, FOXG1, POU3F2 [14]) and a TF with an opposite genomic pattern (TWIST1). The box in the lower right-hand quadrant highlights nine other TFs (black points) (of 1,447 total annotated human TFs [15]) with differential expression and modification levels similar to the transdifferentiation factors (blue points). Data from ([57], [58]) and the Roadmap Epigenomics Project (http://roadmapepigenomics.org). (E,F) Similar plots to (A, B) are shown for factors that convert liver to pancreas (Pdx1 [21]; blue point), pancreas to liver (Cebpa and Cebpb [22]; orange points), and three other TFs with similar genomic patterns (Id1, Pax6, Nkx6-1; black points). Data from [59]–[61] and two other public datasets (Table S1).

