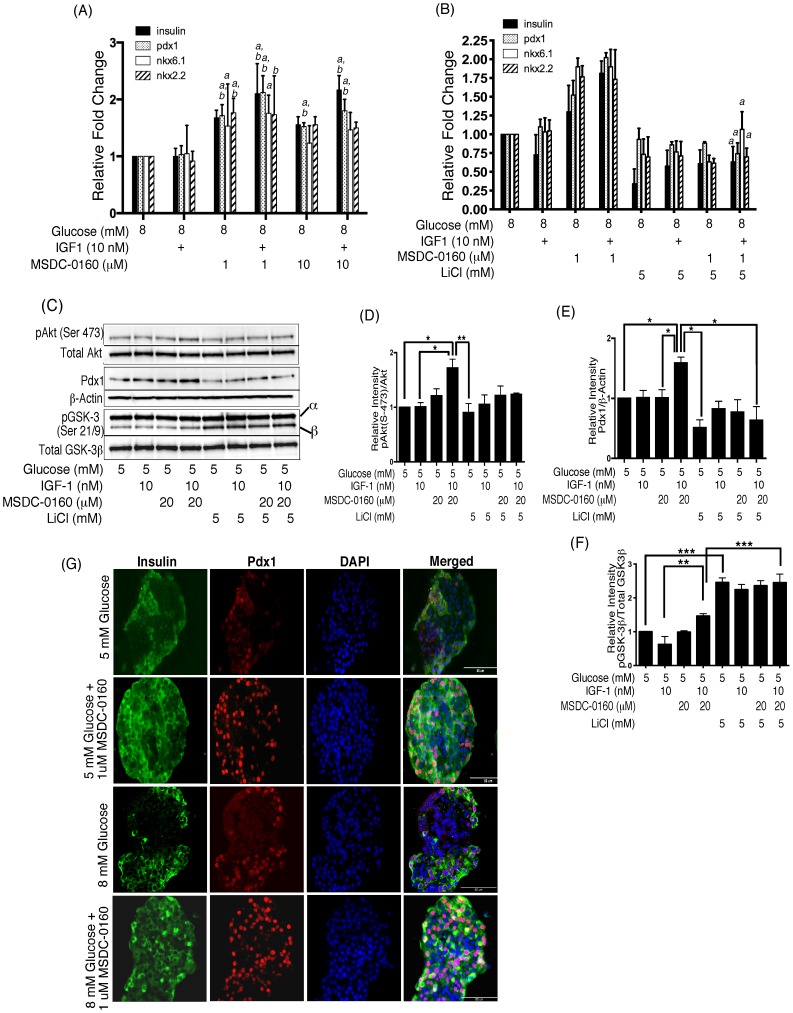
Figure 4. MSDC-0160+ IGF-1 maintains human β-cell phenotype.
(A–B) MSDC-0160 treatment increases expression of β-cell specific genes. Human islets were cultured for 24 h in cCMRL, 8 mM glucose with or without the concentrations of MSDC-0160, IGF-1 and LiCl as indicated. Islets were harvested for RNA isolation, cDNA synthesis and real-time PCR analysis. Taqman probes with primers specific for insulin, pdx1, nkx6.1 and nkx2.2 genes were used. Target genes were quantified by relative quantification using the comparative Ct method. Data are means±SEM of n = 3–4 experiments. In (A), symbols a = p≤0.05 with respect to 8 mM glucose; b = p≤0.05 with respect to 8 mM glucose+IGF1. In (B), a = p≤0.05 with respect to 8 mM glucose+MSDC-0160+ IGF-1. (C–F) Activation of Wnt pathway by LiCl blocks the effects of MSDC-0160 on the insulin-signaling pathway. Western Blots for phosphorylated Akt, Pdx1 and pGSK-3β were normalized to total proteins (Akt, GSK-3β) or β-actin. Left panels show representative Western blots and right panels show mean values after quantitation of the densitometry. Data are means±SEM from n = 4 experiments. Data was analyzed using one-way ANOVA followed by Newman-Keuls test. Symbols * represent p<0.05, ** p<0.01, *** p<0.001. Incubation of islets for 24 h with MSDC-0160+ IGF-1 resulted in significant increase in phosphorylation of Akt, and Pdx1, in comparison to IGF-1 alone (lanes 2 vs. 4). In contrast, LiCl alone had no significant impact on the insulin-signaling pathway (lane 5), but blocked the ability of MSDC-0160± IGF-1 to increase phosphorylation of Akt (Figs. 2A&B, lanes 5–8) and Pdx1 protein expression. (G) Immunohistochemical staining of insulin and Pdx1 in human islets. Human islets were cultured for 24 h in cCMRL containing 5 or 8 mM glucose±MSDC-0160 as indicated on the left of the figure. Islets were embedded in paraffin and 5 µm thick paraffin sections were processed for IHC staining as described in methods. Images were acquired at 40X magnification and are representative of n = 3 experiments. Scale bar = 50 µm. Insulin = green, Pdx1 = Red, DAPI = blue.

