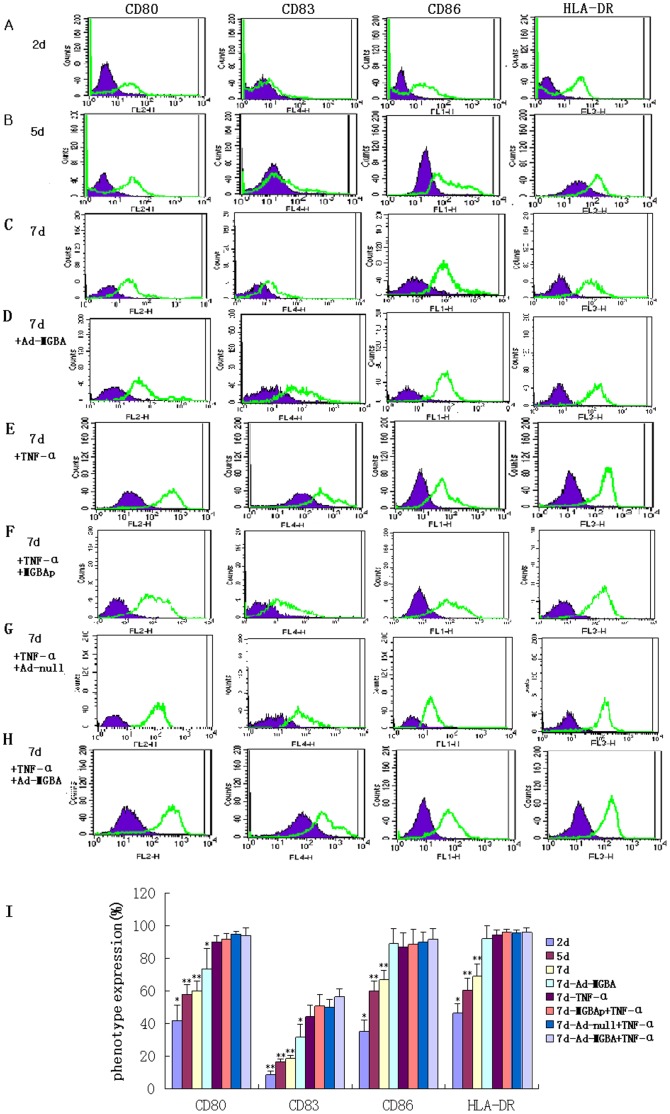
Figure 2. FACS analysis of the changed gene expressions in different DC populations.
A-H displays the data of from one volunteer. (A) 2 day culture; (B) 5 day culture; (C) 7 day culture (not stimulated); (D) 7 day culture and 48 h after Ad-MGBA transfection; (E)7 day culture and 48 h after TNF-α addition; (F) 7 day culture, 72 h after recombinant MGBA protein-pulse and 48 h after TNF-α addition; (G) 7 day culture and 48 h after Ad-null transfection and TNF-α addition; (H) 7 day culture and 48 h after Ad-MGBA transfection and TNF-α addition; (I) The histogram shows the data of six independent experiments from two volunteers as mean ± SE. The cultured DCs were collected and stained with PE anti-CD80, APC anti-CD83, FITC anti-CD86, and Percp anti-HLA-DR antibody, respectively. Isotype control for each group is indicated by blue/grey. * indicates that this group has statistically significant differences compared to the others (p<0.05). ** indicates that there are statistically significant differences compared to the groups without ** (p<0.05).

