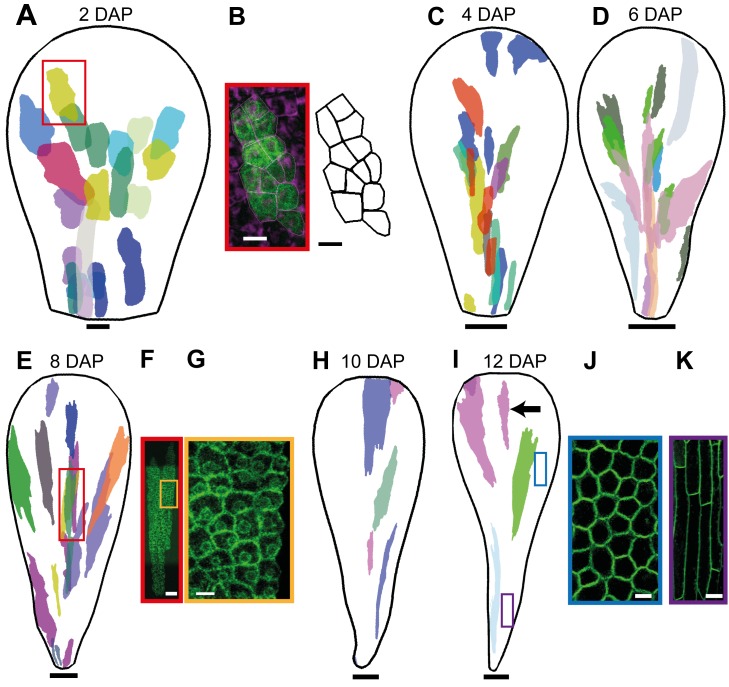
Figure 2. Petal clonal analysis after induction at 0 DAP.
(A) Sector map with shapes and positions of clones induced at 0 DAP and imaged 2 d after induction (at a width that corresponds to 2 DAP). Clones were imaged from dissected, flattened petals and warped to an average petal shape and overlaid (using a different colour for each petal). (B) Image of a distal epidermal clone (framed with a red box in A) and the corresponding outline of cells. (C) Sector map with clones induced at 0 DAP and imaged 4 d after induction (at a width that corresponds to 4 DAP). (D) Sectors imaged at 6 d (6 DAP). (E) Sectors imaged at 8 d (8 DAP). (F) Image of a distal epidermal clone (framed with a red box in E). (G) Enlargement of the yellow box in (F) showing some epidermal cells. (H) Sector map with clones induced at 0 DAP and imaged at 10 d after induction (10 DAP). (I) Sectors imaged at 12 d (12 DAP). The black arrow points to a distal clone. (J) Distal epidermal cells at 12 DAP at the position of the blue box in (I). (K) Proximal epidermal cells at the position of the violet box in (I). Images at (A, C–E, H, I) are scaled to the same length to allow the difference in clone shape to be compared. Scale bar, 5 µm (B, G), 10 µm (A, J), 20 µm (F, K), 50 µm (C), 100 µm (D, E), 200 µm (H), and 300 µm (I).

