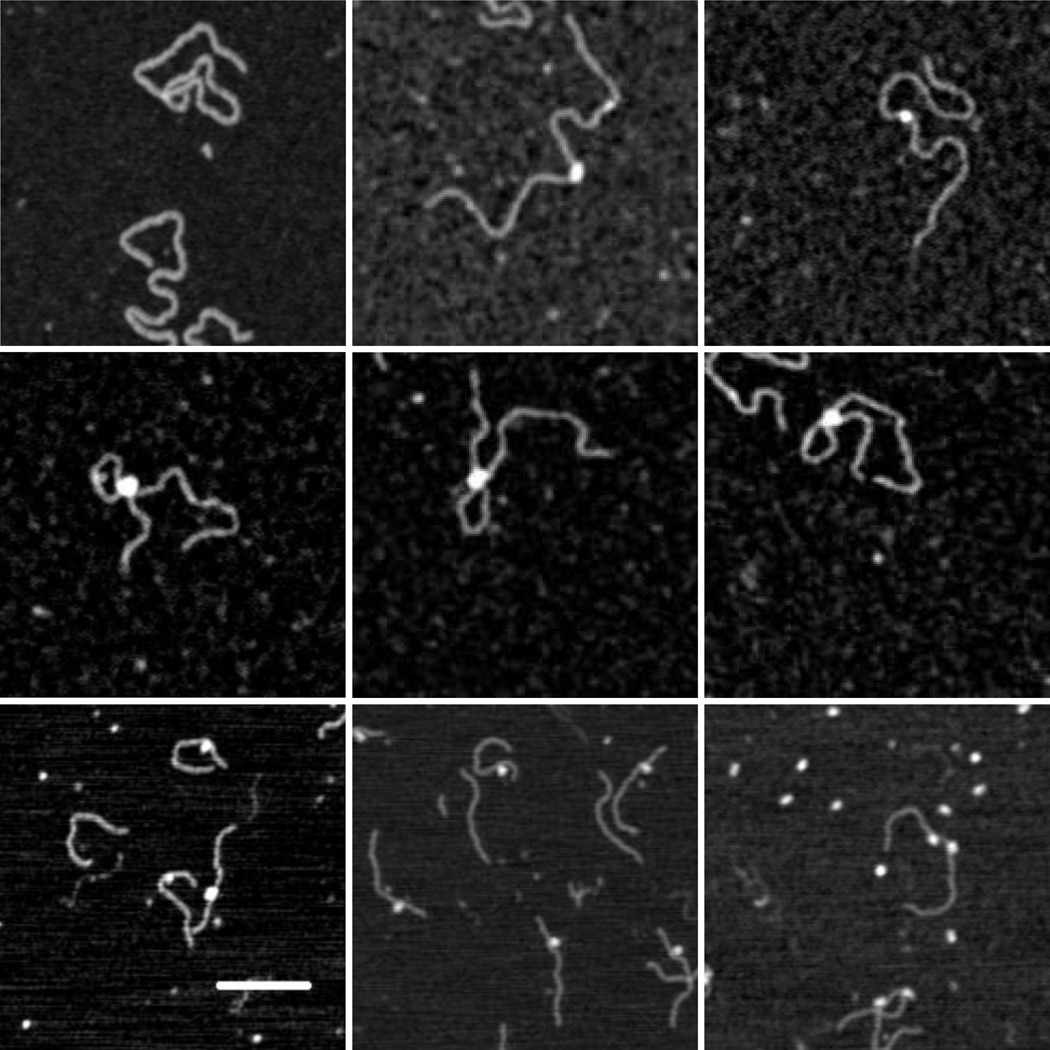
Figure 1.
AFM images of CI and DNA: (upper left) 1555 bp DNA containing OL and OR, (upper middle and right) CI protein bound to 1555 bp DNA, (middle row) CI- mediated loops in 1555 bp DNA, (bottom left) CI bound to DNA containing OL (wild-type), (bottom center) CI protein bound to DNA containing OL (O3-), (bottom right) lac repressor bound to Oid and O1 containing DNA. The white bar represents 100 nm.

