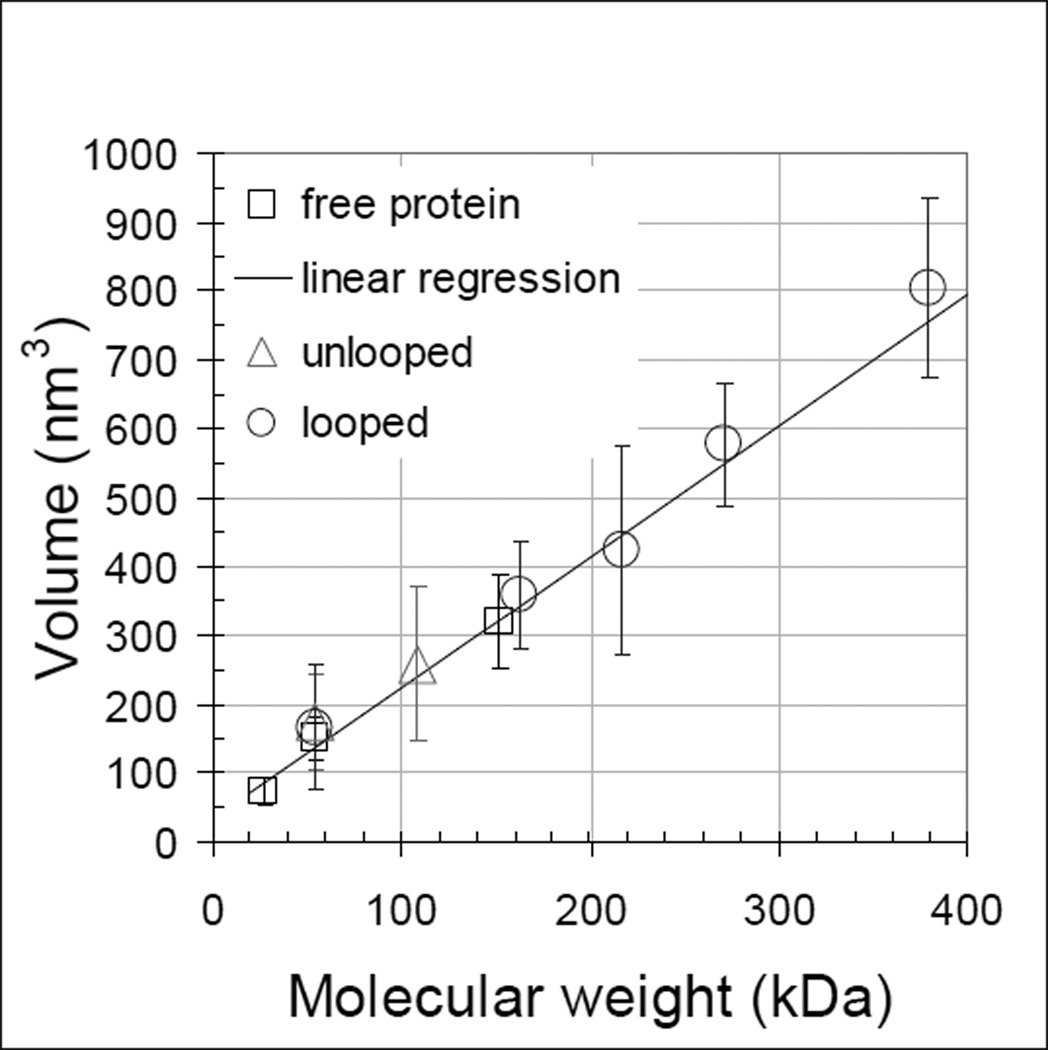
Figure 4.
AFM measurements of the volume of protein particles both free and bound to DNA. Standard deviations are indicated for all points. Linear regression of volume measurements of unbound λ and lac repressor proteins (dark squares) gave the calibration line (dark). The volumes of CI protein particles were measured on unlooped (grey triangles) and looped (grey circles) DNA and CI oligomerization values were assigned to the nearest dimer multiple using the calibration line. Numerical values for the plot are given in supplementary table S3.

