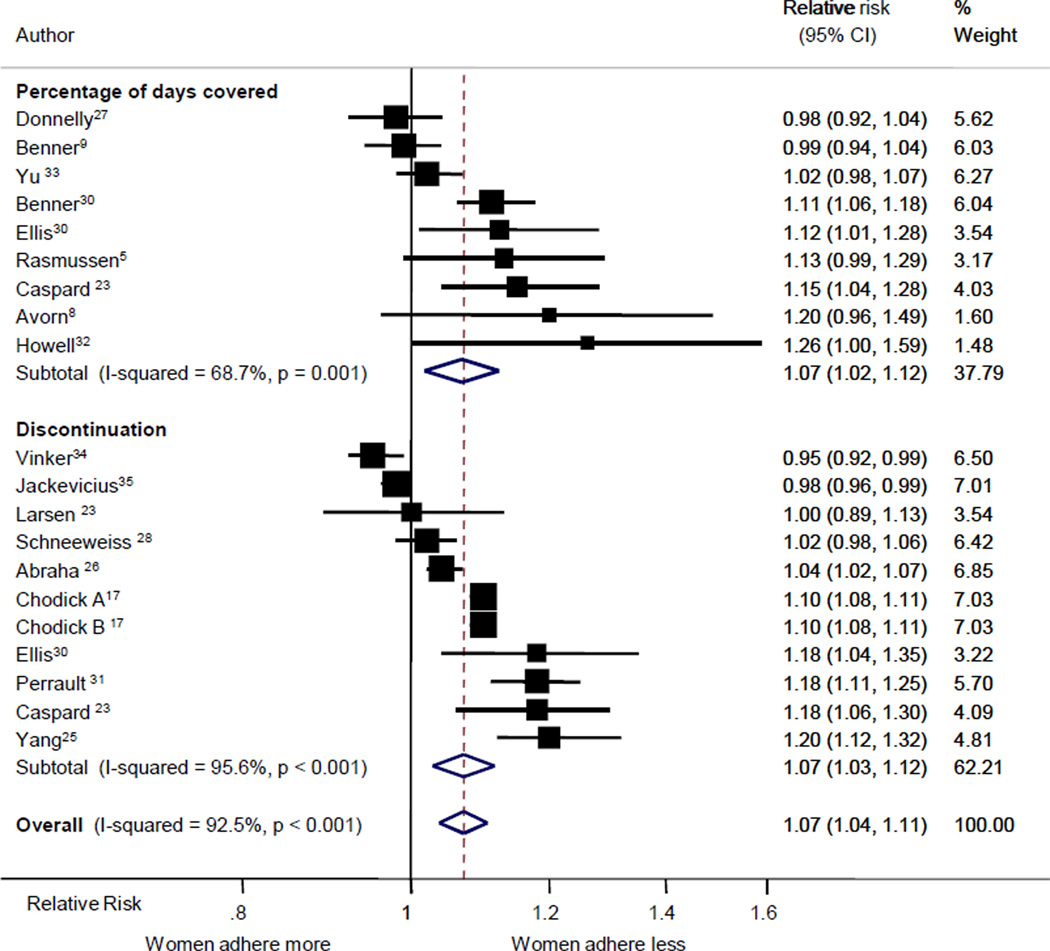
Fig 2.
Forest plot of relative risks for non- adherence comparing women to men. The center of each box is plotted at the relative risk for that study; the boxes are drawn in proportion to the amount of statistical information provided by that study; and the lines go out to the 95% confidence limits.

