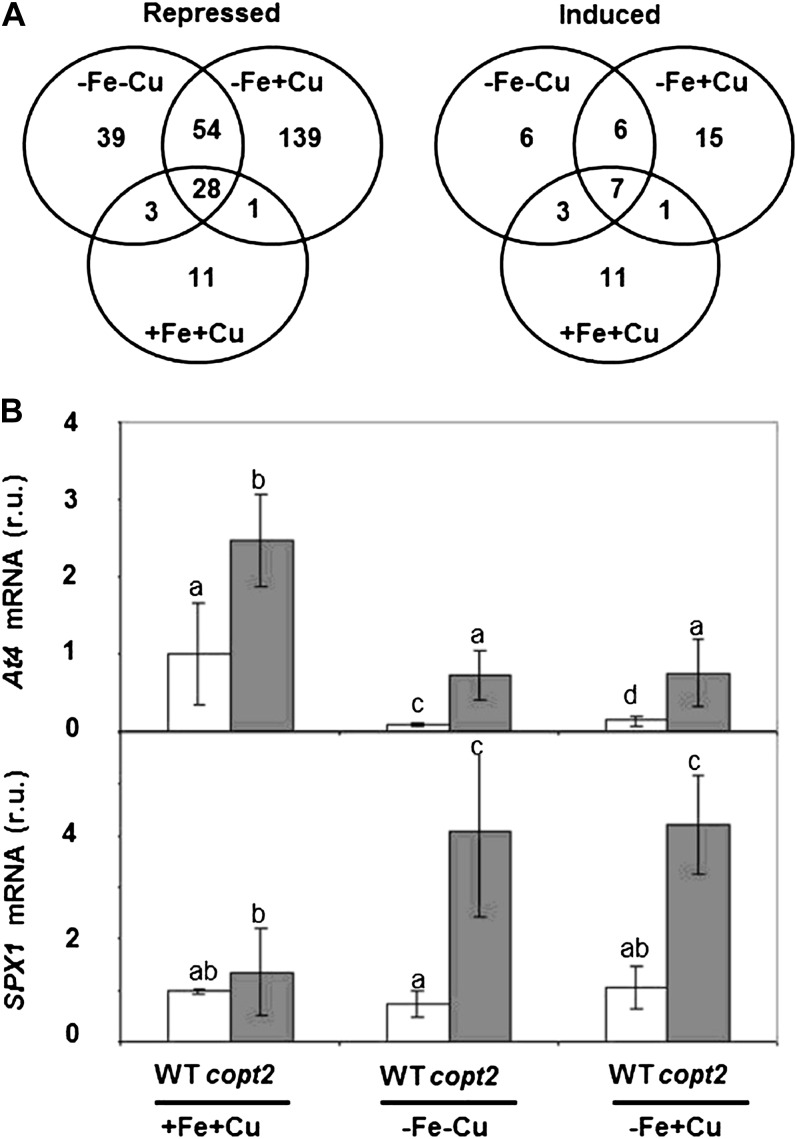
Figure 9.
Venn diagrams of gene expression changes in wild-type versus copt2-1 seedlings under different metal statuses. A, Values indicate the number of induced/repressed genes grown under the same conditions described in Figure 3B in copt2-1 seedlings: control (+Fe+Cu), Fe deficiency (−Fe+Cu), or Fe and Cu deficiency (−Fe−Cu). B, Expression analysis by qPCR of At4 and SPX1 in wild-type (WT; white bars) and copt2-1 (gray bars) seedlings, as described in A. UBQ10 gene expression was used as a loading control. Values are means ± sd of at least three biological replicates. r.u., Relative units. Different letters above the bars represent significant differences among all the means (P < 0.05).

