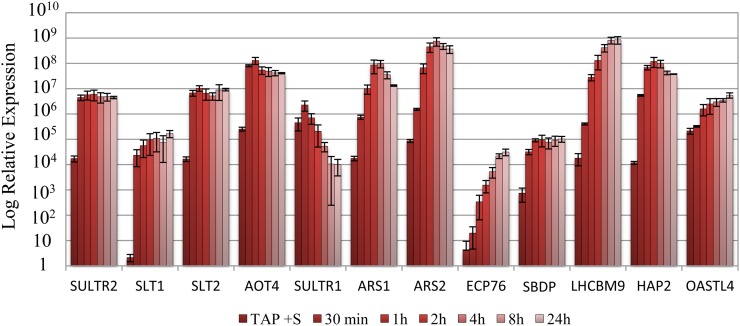
Figure 3.
Changes in transcript abundances for various S deprivation-responsive genes following the removal of S from the medium. Levels of transcripts encoding SULTR2, SLT1, SLT2, AOT4, SULTR1, ARS1, ARS2, ECP76, SBDP, LHCBM9, HAP2, and OASTL4 were measured by RT-qPCR. RNA samples were isolated from wild-type cells (21gr) grown in S-replete medium and after being transferred to S-depleted medium for 30 min and 1, 2, 4, 8, and 24 h. [See online article for color version of this figure.]

