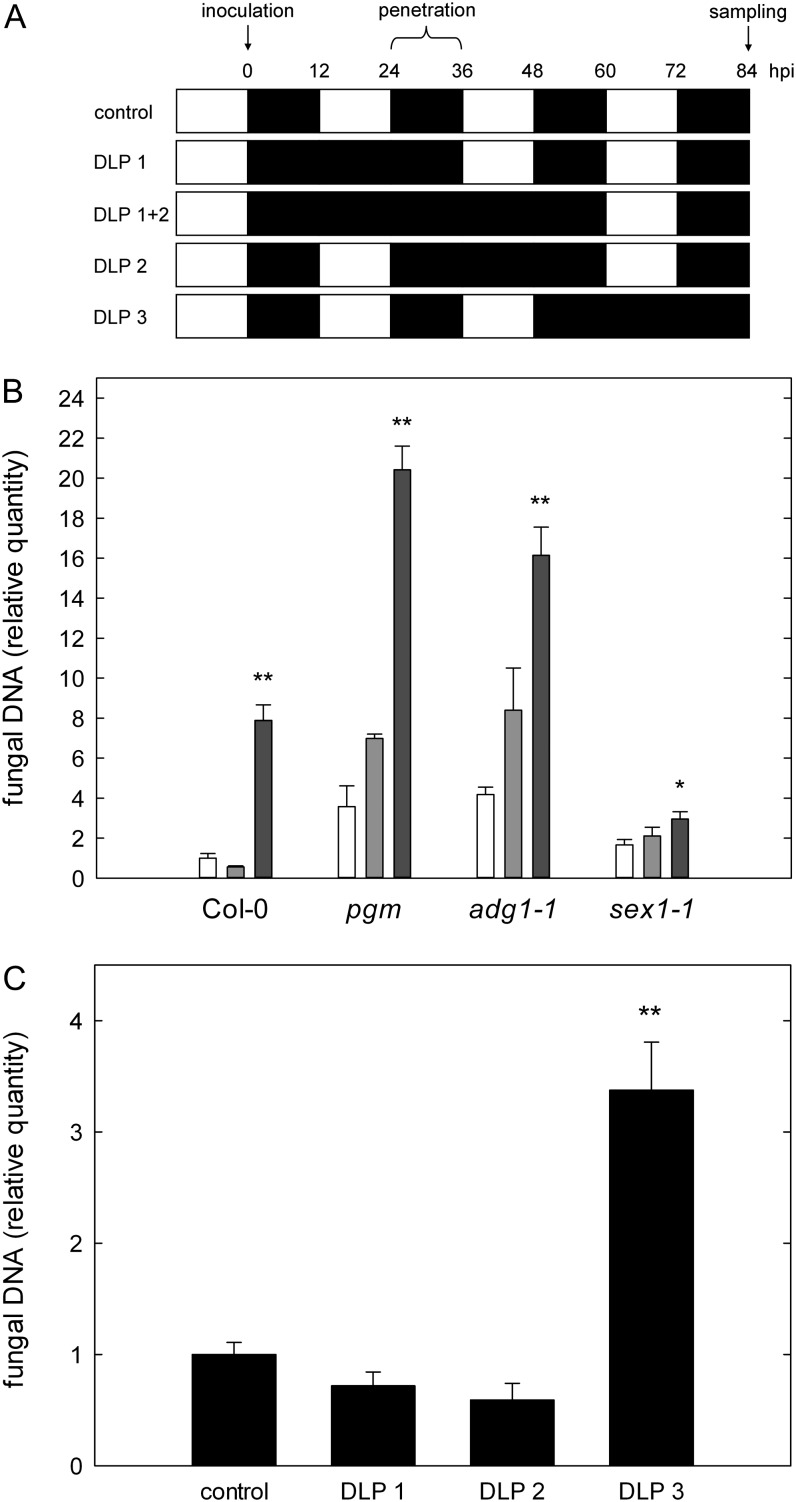
Figure 4.
Susceptibility toward C. higginsianum after dark-induced starvation. Plants were dark incubated after infection with C. higginsianum, and the relative quantity of fungal genomic DNA was determined by qPCR in leaves harvested at 3.5 dpi (84 h post infection [hpi]). A, Schematic overview of the combinations of DLP applied after the infection. The relative time of fungal penetration and sampling after inoculation is indicated above as a time scale. B, Relative quantity of fungal genomic DNA in leaves of Col-0, pgm, adg1-1, and sex1-1 at 3.5 dpi. Control (12-h/12-h light/dark), white bars; DLP 1, light gray bars; DLP 1+2, dark gray bars. C, Col-0 control compared with Col-0 with DLP 1, DLP 2, and DLP 3. For each replicate, leaves were pooled from two separate plants. Values are means of three biological replicate pools measured in three technical replicates ± se. Asterisks indicate significant differences between DLP samples and control samples (*P < 0.05, **P < 0.01, Student’s t test).

