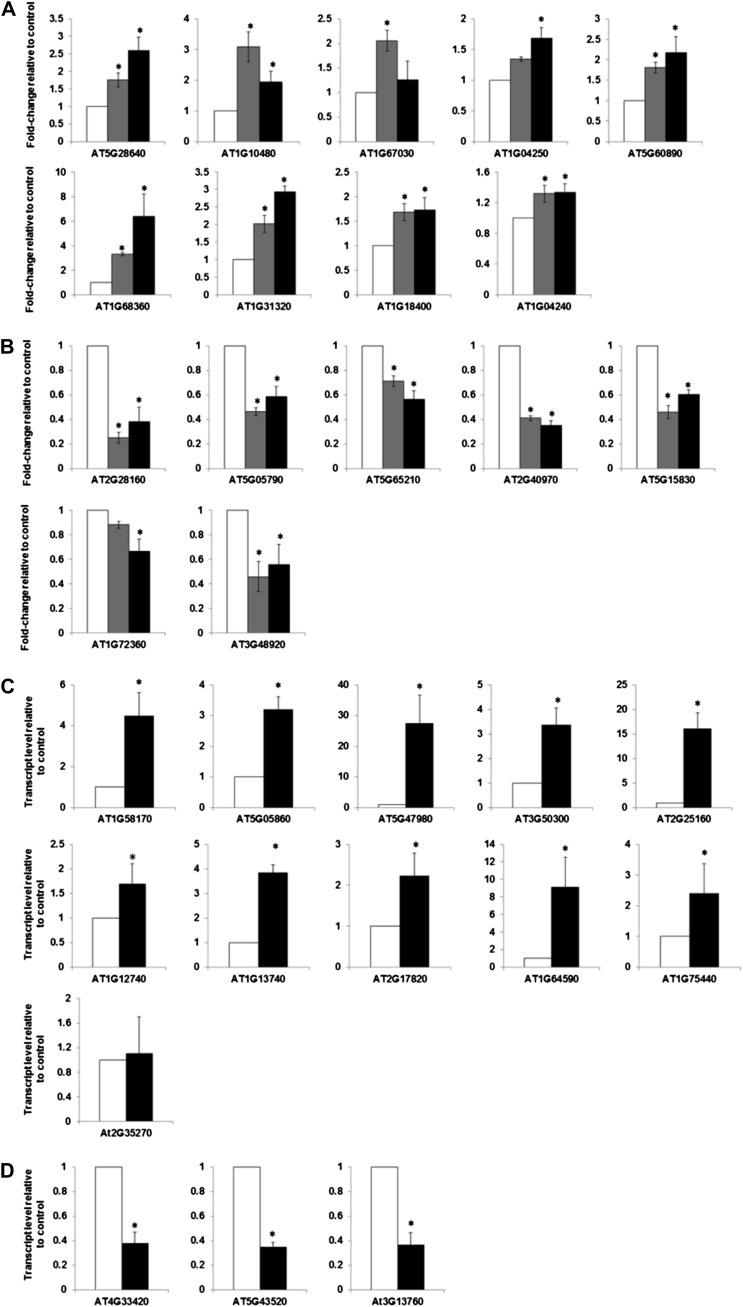
Figure 3.
Validation of golden list candidates by nCounter gene expression analysis and quantitative RT-PCR. A, NanoString nCounter gene expression analysis of up-regulated representative genes from the golden list. B, NanoString nCounter gene expression analysis of down-regulated representative genes from the golden list. For A and B, 10-d-old light-grown seedlings were treated with 5 μm BA or a DMSO vehicle control for 60 or 120 min as indicated, and the normalized counts for indicated transcripts were determined. Error bars indicate the mean ± se from three biological replicates. C, Relative transcript level of the up-regulated representative genes from the golden list as determined by quantitative RT-PCR. D, Relative transcript level of the down-regulated representative genes from the golden list as determined by quantitative RT-PCR. Ten-day-old light-grown seedlings treated with 5 μm BA or a DMSO vehicle control for 120 min were used for quantitative RT-PCR. The level of transcript relative to the DMSO control is shown as a mean of three biological replicates ± se of the mean.

