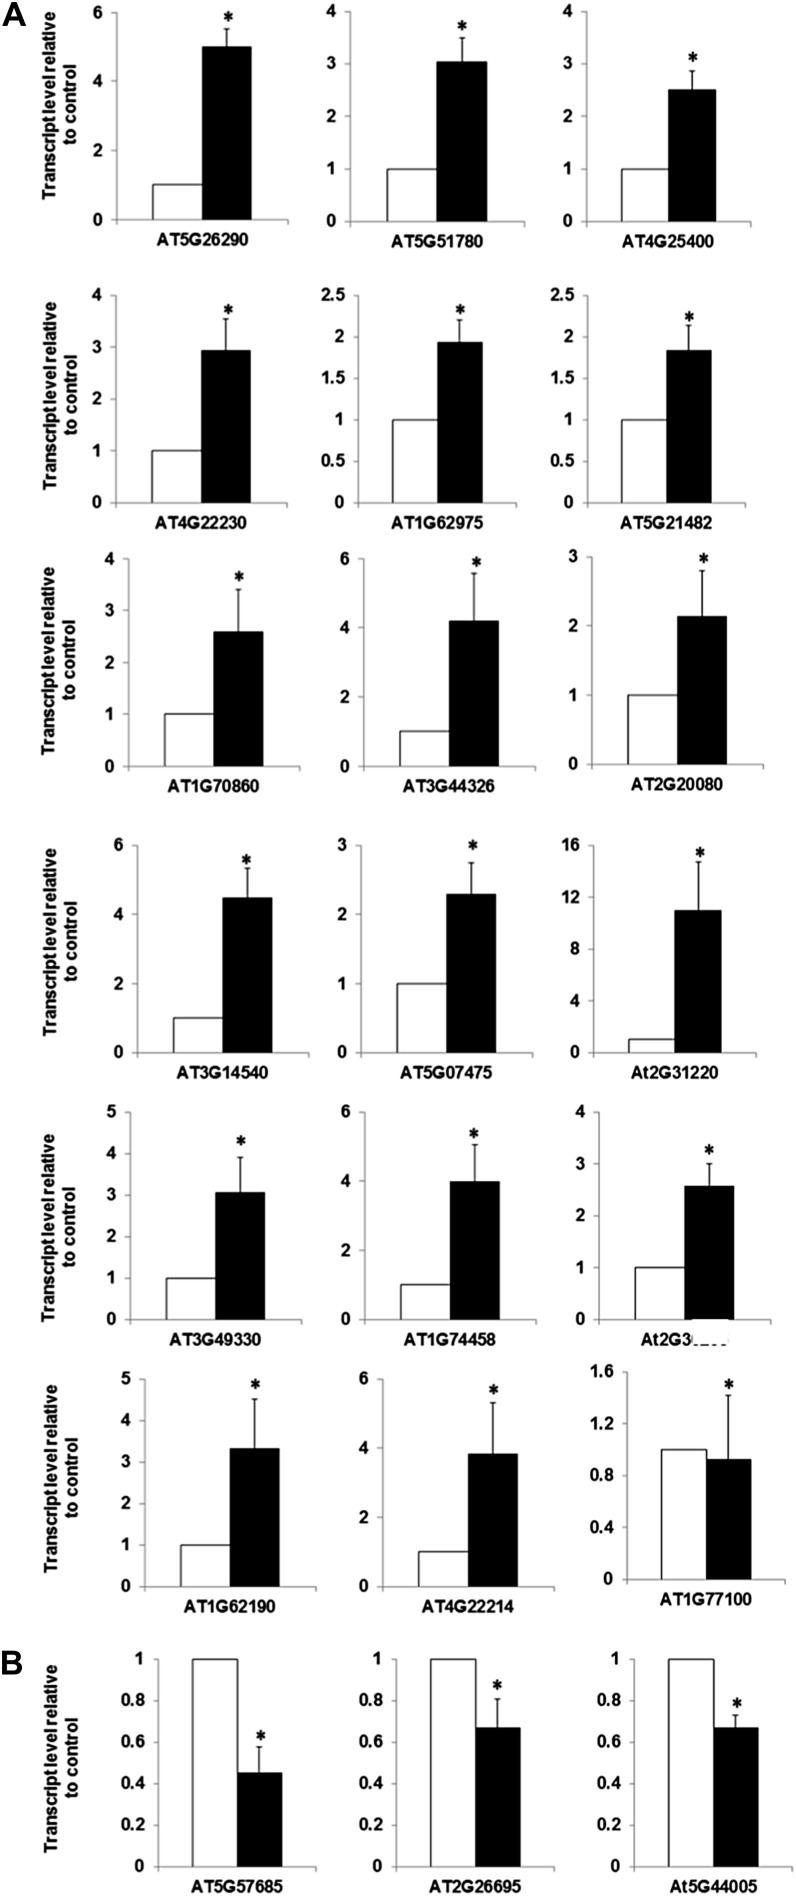
Figure 5.
Validation of the cytokinin regulation of a subset of genes identified by RNA-seq that is not present on the ATH1 microarrays. A, Relative transcript level of the up-regulated indicated genes. B, Relative transcript level of the down-regulated indicated genes. Ten-day-old light-grown seedlings were treated with 5 µm BA or a DMSO vehicle control for 120 min and were determined by quantitative RT-PCR. The level of transcript relative to the DMSO control is shown as a mean of three biological replicates ± se of the mean.

